Vatican Manuscripts Added Week 0 of 2022
This is the second part of the year-end review for 2021. Since, as of Jan. 3, 2022, the Vatican was hard at work digitizing more manuscripts, this is getting inserted as a special, out-of-band, entry. The previous entry covered what happened inside the software in 2021, this will try to give an overview of manuscript additions over the year
Just the Numbers
This year a total of 2,148 manuscripts were digitized, or an average of 44 a week (there are about 49 work weeks in a calendar year)1. This represents a significant increase over 2020 (1,835) but not yet back to the level seen in 2019(2,395)2. As a comparison, during 2021 the British Library digitized 273 items
Fond by Fond
These manuscripts were spread across 33 fonds, however just over half, 17, of those fonds contributed fewer than 5 manuscripts. See a fond-level breakdown below3.
An interesting detail in the data is that these fonds are not evenly represented across the year, which maps with my intuitive analysis as the weeks passed. Ignoring Vat.lat, the majority and evenly spread across the year, the year started with Greek manuscripts, Urb.gr and Vat.gr, and a smaller number of Armenian ones from Borg.arm. Apart from Week 20, with the singular influx of bindings from Legat, this set the pattern for the first half of the year. Starting after the August vacation, the Rossiani collection became a significant part of the weekly digitizations, and then beginning on the 40th week, Reg.lat made an appearence, soon increasing to the majority of some weeks digitizations. The year ended with a surprise influx of manuscripts from Pal.lat which, having already been available in the Heidelberg repository, were finally making it into the Vatican4 .
Metadata
Of the 2,148 manuscripts this year, I was able to add at least some piece of metadata (Author, Title, Incipit or Date) for 2,042, or 95% and full metadata for 590, a respectable 27.4%. Late in the year the two volumes of the Wilmart catalogue of Reg.lat, covering codices 1-500 were digitized. I have been able to add to the records for those manuscripts in the first volume already, and hope to cover 251-500 in the coming year.
Sources
Graphs generated using sqliteviz
select avg(num_added) from (select count(*) as num_added from manuscripts where year(date_added)=2021 group by week(date_added)) as added_per_weekselect year(date_added) as year_added, count(*) from manuscripts group by year_addedselect fond_code, count(*) as ms_count from manuscripts where year(date_added) = 2021 group by fond_codeselect week_added, if(number_added>5, fond_code, "Other") as other_fond_code, sum(number_added) from (select week(date_added,4) as week_added, fond_code, count(*) as number_added from `manuscripts` where year(date_added) = 2021 group by week_added, fond_code) as all_tables group by other_fond_code, week_added
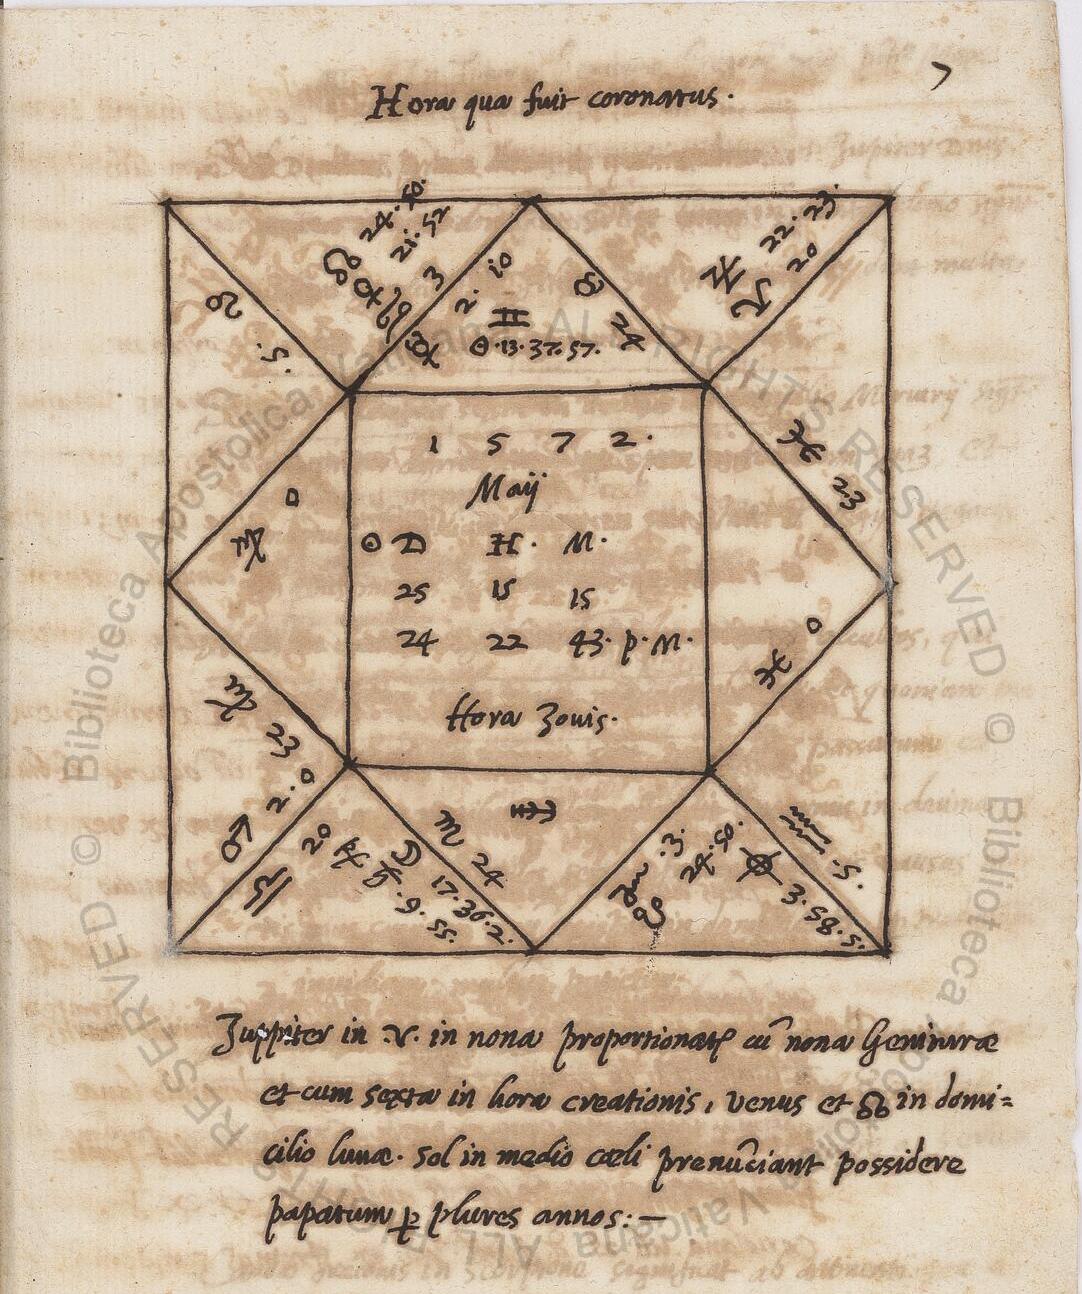
The image to the right is f.7r from Vat.lat.6157, a collection of horoscopes plotted by Alfonso Ceccarelli from 1580. Hopefully it will presage a calmer 2022