Showing posts with label Digital Humanities. Show all posts

2018-08-07

How Was the Tabula Peutingeriana Made?

In the 500 years since the rediscovery of the only extant Roman chart of the world, no one has proved how it was made. I am treating that as a challenge.

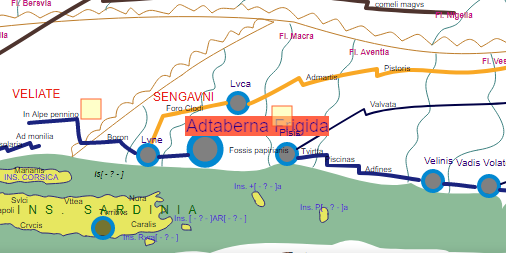
There is now progress towards a solution to report. My working method is to revisualize the manuscript, the Tabula Peutingeriana, by laying its route network over a modern map of the world. This is impossible to do with the whole TP chart, but surprisingly this works quite well with some more localized regions.

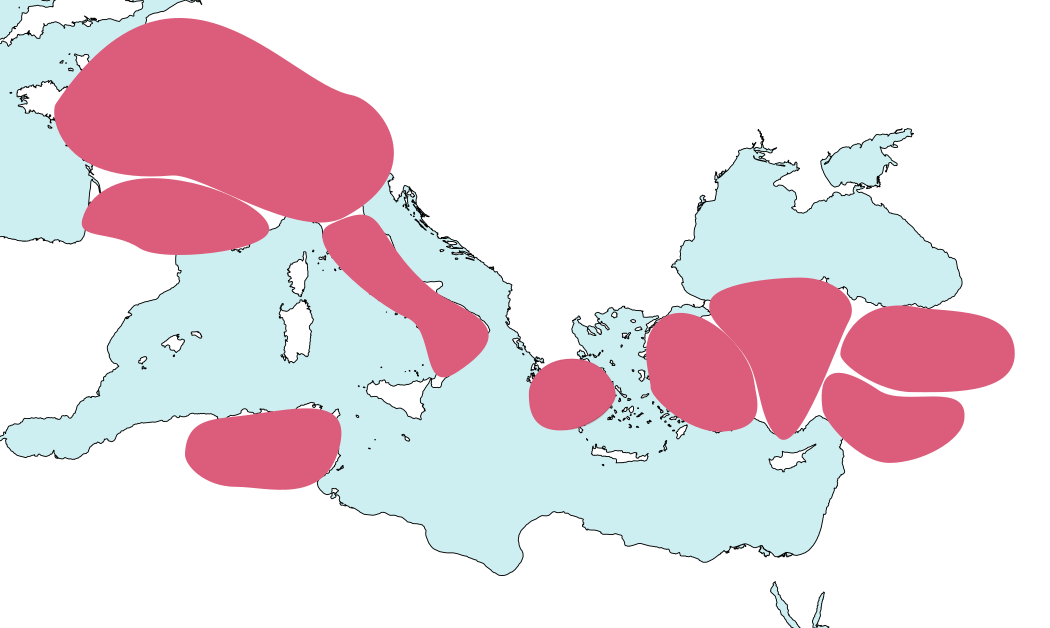
If one increases the page height of the route network, one often finds a sweet spot where the layout of a whole swatch of cities fairly closely matches their pattern on a modern map. This correspondence between overlay and underlay rarely extends beyond discrete geographical areas, for example Greece or the Italian peninsula. After surveying about 60 per cent of the Tabula, I have so far found nine of these patches. This diagram of their locations around the Mediterranean Basin shows them:

At the time when I was discovering the first three or four by trial and error (previous post), I was still sceptical. I did not even bother to note the patches' exact angles of divergence from a north orientation, and I still remained concerned that the patches might later turn out to be nothing more than a chance alignment in the data.

But by the time I moved to analysing Anatolia it was clear that alignment was a rule that was a reliable predictor of where towns were going to be found on the TP.

These patches are in some way comparable to the wireless cells of a cellular phone system extending over a landscape. Unlike a territory, the edges of the cells are not distinct, and there are some places that are outside any cell. But within each cell, an objectively measurable value prevails uniformly.

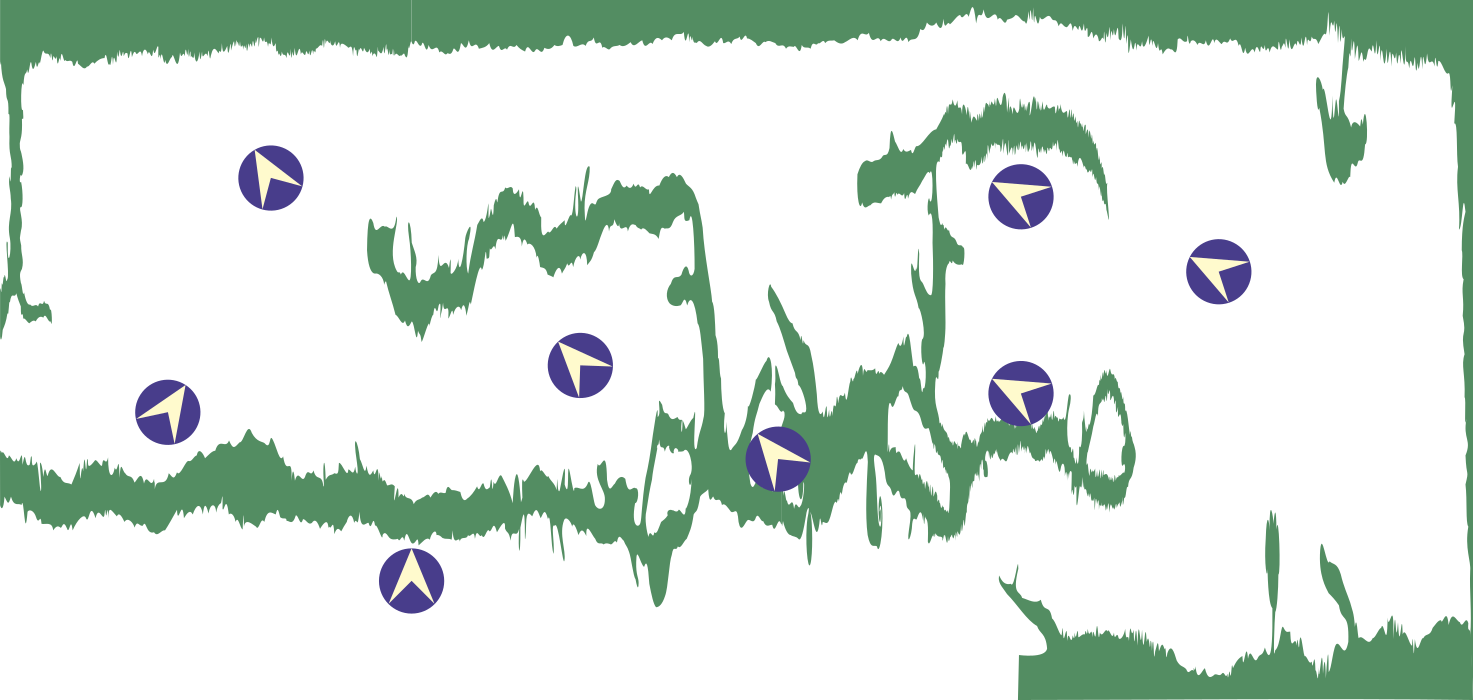
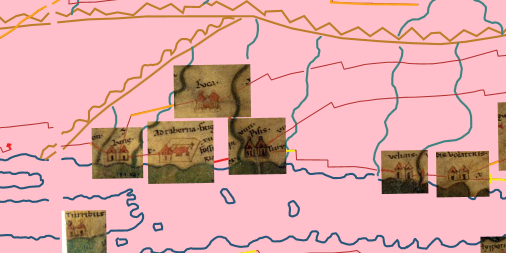
The phenomenon can alternatively be visualized by showing bearings on a horizontally compressed copy of the Tabula Peutingeriana. In the following sketch, you can see how Provence (the leftmost region) is drawn with north at the upper right, whereas Gallia Comata (top left) has north at the upper left:


The cells are distinguished from their neighbours by an objectively measurable value: an angle of difference between lines of longitude (I have the latitude/longitude data for these places) and verticality between places on the TP (I have a database of the coordinates), as shown below.

We could attach a mathematical value to every place-label on the chart, group these and analyse them statistically to find more patterns.

This is still a work in progress, and I can only speculate about where this is leading to. But I have a suspicion. The maker of the Tabula Peutingeriana may have designed his diagram with the help of a collection of "chorographic" charts which depicted different regions with varying orientations.

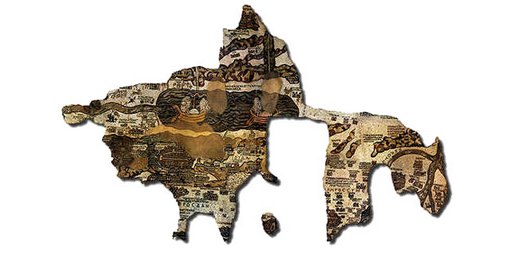
A majority of scholars nowadays think that the world of antiquity had little familiarity with scale maps (despite Ptolemy of Alexandria having written a book, still extant, on how to make a map of the world). A cruder type of chart, the pinax chôrographikos, was adequate to explain locations visually, and even this visualization may not have come into use among educated people until late antiquity.

The only instances of an ancient Greek/Latin pinax chôrographikos we know at present are the mappaemundi (see my previous post), the controversial sketch on the "Artemidorus Papyrus" and the Dura Europos "shield". Each of these seems to have a different compass direction at top and it may be that a varying, ad hoc orientation is the hallmark of the pinax chôrographikos.

If this hypothesis turns out to be correct, it may be that we will be able reconstruct several more pinakes using the data in the Tabula Peutingeriana, which would mark a major advance in the study of early cartography.

You can see the graphic abstracts for eight of the TP cells on my website, as listed below. On each chart, press the "landmass-on" button to see how the layout compares to the geographical situation.
The seventh and last visualization unites two cells, Bithynia-Galatia on the left and Cappadocia-Euphrates on the right. I have not yet completed a visualization for Syria, although I pre-emptively marked this as a red cell in my drawing above.

Each of these revisualizations may give at least the layout of what might have been drawn on an early pinax.

The more immediate object of this research is however to focus on the creation of the TP, which might have taken place as follows:
  1. The compiler copied pinakes of all the regions of interest;
  2. Using texts, he copied travel itineraries onto the pinakes and connected the sheets without concern for the compass orientations.
  3. His final copy of this assemblage drastically reduced the height of the chart to the TP as we see it.
This is nothing more than a proposal, and it differs in some of its details from the best hypothesis being offered today, that of Professor Michael Rathmann of Germany, who also sees the TP as a chorographic map. But the idea would at least bear further study. Use the comments box below if you wish to respond.

2018-08-01

New Edition of the Tabula Peutingeriana

The Tabula Peutingeriana is a UNESCO Memory of the World treasure which is the nearest thing to a Roman road-map still in existence.  Today I have relaunched the Tabula Peutingeriana Animated Edition with some major improvements to help both scholars and the general public understand this priceless roll now kept in a Vienna vault.

The biggest improvement to my digital reproduction at piggin.net/ta.svg will be visible when you start hovering a cursor or holding a finger on the yellow boxes which mark the mutations. In many cases, the lines now move incrementally so that you can compare the before and after states.

I hope readers will begin to perceive the Tabula more sympathetically, realizing that is is damaged rather than hopelessly old and wrong. Despite its idiosyncrasies, there is a more rationality to it than meets the eye.

The animations were technically complex to build with SMIL coding, but I decided the effort was worth it, because it can sometimes be quite difficult to spot the differences when simply flipping between two static views. On a slow computer you may find it takes a while for each of the animations to kick off, so it is prudent to hover in and out a couple of times to make sure you have seen all the steps. In Microsoft's Edge and Explorer browsers they do not seem to work at all. Use another browser.

The second big improvement here is the addition of a new database of annotations to the 62 emendations so far. I have launched this in the form of a blog, Restoring the Tabula Peutingeriana, to make it as easy as possible for readers to comment directly on every note. There has never been any central forum for these issues and I would be very glad if scholars would come here if they need, on the fly, to discuss the cases.

Other improvements include an extension of the chart's colored and emended area to Asia Minor as far as Samsat and a new link policy whereby all my charts will have very short, easily noted URLs such as piggin.net/ta.svg to make it easier to cite them. ta stands for Tabula Animated.

2018-05-03

Show Me Your Money

The Vatican Library's digital portal expanded this week to take in three new classes of document:
This takes the number of classes to seven. The manuscripts and incunabula (pre-1500 printed books) are the central treasures. The current total of manuscripts online is 15,970 items out of a total of more than 80,000. The inventories are the handwritten catalog books from the Library reading room, 270 of them, which are quite difficult to use. The archives is a collection of deeds and similar documents held by the Library proper, not in the Vatican Secret Archives. The latter four have been present online for some time.

The three new collections this week are the "Visual Materials", the "Printed Materials - Special Projects" (Materiali grafici e oggetti d'arte), and "Coins and Medals". The visual materials seem to be what an English library would call ephemera, mainly printed pamphlets or broadsheets (some scanned at dreadfully low resolution). An example is Stampe.I.96 showing St Peter's in 1655:

The distinction from "materiali grafici" is not quite clear to me, but as far as I can see these are single photographs of stamps and engravings found in books, presumably post 1500. At the moment this seems quite limited in scope.

The medals are fairly well scanned, though there does not seem to be sufficient post-processing to reduce glare. The 1506 (or 1512) item below by the engraver Cristoforo Foppa shows too much light on the shepherd's right thigh (this shepherd represents Pope Julius II as a caring ruler):

I am not planning to monitor these three new classes, as they are both non-medieval and of narrower interest than the manuscripts.

More may emerge about where the digitization program is heading later this month when the Vatican Library is hosting a one-day conference. You can invite yourself on Eventbrite, and it is free. The occasion is the completion of a 2012-17 project by the Polonsky Foundation to fund the digitization of key treasures.

Luminaries speaking include Anthony Grafton (@scaliger) and top librarians including Emma Stanford (@e_stanf) and Jill Cousins (@JilCos) from Europe. It's certain to be a love-feast, though I don't see Europe's one other mega digitizer, Gallica, attending.

I would love to attend, but regret that I cannot go for health reasons. I would love it if any eager reader could attend as a reporter and blog and tweet about the presentations!


Another multi-million dollar project that has just been completed without a stumble is the Bibliotheca Palatina digitization. The press release flags an official ceremony on February 15 in Germany with Manfred Lautenschläger, the German millionaire who generously stumped up the cost of scanning the 3,000 Latin codices, and at the ceremony urged wealthy people to imitate his giving.

The digitization restores to Germany in virtual form a precious library that was spirited away from Heidelberg 400 years ago. This pioneering work, which was managed by Heidelberg University Library, benefited the wider Vatican project too, because the Germans set up a proper digitization studio at the Library in Rome and developed basic technical standards which are still in use.

The Rhein-Neckar Zeitung news report says the work got into high gear once the Vatican Library provided a second studio, but quotes Heidelberg chief librarian Veit Probst saying 402 Greek, 430 Hebrew and maybe several hundred unidentified Oriental manuscripts originally from Heidelberg still need to be digitized.

Now that two major funders have completed their projects, the big question now is: who is going to step up with a few million euros to sustain the digitization of the remaining 60,000 manuscripts.

2018-04-20

Digital Mappa(emundi) is Back

Long long ago (2010) on this blog, I posted about Digital Mappaemundi, a new web portal, which I said with orotund optimism "looks as if it will become a wonderful and important resource". It then more or less vanished. Reader Aaron M. (@gundormr) surprised me yesterday with the news that this one is still alive, now called Digital Mappa, with its own web domain and Twitter feed, and that DM 1.0 beta software was released as an open access product this week.

The idea was to create portals where digital images of manuscripts overlaid with digital plots and transcriptions and coexist with hyperlinks to similar manuscripts so that readers could explore them with ease. In the years since DM first poked its head above the parapet, I heard of various projects of a similar nature which generally seemed to die when grants ran out or the poor student doing the donkey work graduated.

Perhaps the biggest deal in this period was the creation of IIIF, a standard to mark up manuscripts so that they can be exhibited online side by side. I still find IIIF a bit baffling, with a dearth of tutorials and models.

Let's be frank: the way the web has always grown in the 20 years I have known it is that you find a good portal and then shamelessly pirate its code and its best features for your own project. I presume my own code has babies all over the place. But I have never found any IIIF project I could clone, and will be interested to see if DM sites are capable of parthogenesis. DM says it will be IIIF-capable from next year in a planned update. The indication that you need a network admin to start a DM project already sounds off-putting: is it that hard?


For a look around, try the Virtual Mappa collection, which contains various mappaemundi from London. I haven't yet seen enough to review it, though the images seem to take forever to load. The Twitter feed takes you through some of the important features. For the time being, I am continuing to make simple SVG digital plots like that of the Albi Mappamundi which I presented earlier this week.

2018-03-26

Madaba Map online at last

The late antique Mosaic Map (below) in Madaba, Jordan is the world's oldest detailed Greek-language topological diagram still in existence. It is both a tourist attraction of the first order and a landmark in human cognitive history, since it indicates that sophisticated topological diagrams (though not maps) were in common use and well understood by the general public in the west by about 550 CE.

Four or five hundred years earlier, over-the-horizon diagrams had not been part of the culture. There is a continuing controversy about the Agrippa Survey, a public mural in Rome mentioned (once only) by Pliny the Elder which detailed the regions of the empire and their sizes. Whether it was a list or a diagram has never been conclusively proved.

Topological diagrams come into their own in late antiquity, with the Tabula Peutingeriana (preserved in one roll-form manuscript in Vienna, ÖNB cod. 324) and the Madaba "Map" as the two key examples. The fragment at Madaba is a mosaic floor in a church. It was originally much larger. But even depleted, its colorful depiction of Palestine and Jerusalem is amazing.

While the Tabula Peutingeriana is now online in the highest resolution at the Vienna library and in more convenient form at Richard Talbert's website, quality reproductions of the Madaba Mosaic are unfindable online. To my knowledge it has been published only twice: a painstaking colored drawing at 1:4 scale by Paul Palmer in 1906, and in a book of photographic plates by Herbert Donner.

A few weeks ago I decided to do something about this problem. I contacted the University of Toronto Library, where the Robarts Collection owns a printed copy of the Palmer drawing in the form of a large-format book printed at Leipzig. Palmer died in 1935, so the book is in the public domain. I suggested it be added to the library's admirable digitization program. Now, a few weeks later, it can be inspected online at the Archive.org library of books.

Here's a fish in the River Jordan:

These are houses in the city of Jerusalem:

Palmer was a Jerusalem architect of German-Swiss extraction, who relates in a short autobiography online:
During our involuntary stay at the Jordan we were told by some Arabs of Madeba that a beautiful mosaic-map of Palestine had been found while they were flooring the new Greek church. We decided to ride to Madeba at the first opportunity and to inspect this mosaic-map, to sketch it or to take some photographs. But, when we got there we could not get a true picture. Later by accident, two painters were staying in Jerusalem and I rode with them to Madeba. Working for several days, I made a drawing of the mosaic-map, I painted the exact colours of each of the stones and a copy of the original painting will still be obtainable from the Society of the German League for Exploration of Palestine (Gesellschaft des deutschen Vereins zur Erforschung Palästinas).
Herman Guthe (1849-1936) who wrote the book of commentary issued with the map, tells a slightly different story, in the Zeitschrift des Deutschen Palästina-Vereins, saying the board of the society commissioned the drawing and Palmer travelled to Madeba in May 1901 to make it. Guthe notes how difficult travel then was: just the horse ride from the bank of the Jordan up to Madaba took eight hours.

A summary of sorts by Aharon Yaffe appeared in the Israel Review of Arts and Letters in 1998. The Palmer drawing at half size was republished in 1954 in Professor Avi Yonah's book, The Madaba mosaic map: with introduction and commentary (not online) and on a single sheet by the same publisher, the Israel Exploration Society, but eSbírky.cz in Prague, the only digital image repository holding the latter, seems to be permanently down.

Ill-lit tourist snaps of the mosaic are of no help and UNESCO's listing of the whole Um er-Rasas World Heritage site of which the church is part does not have any image of whole floor. Göttingen University's facsimile of the mosaic is good, but individual stones are not resolved in the online image.

That is why the long-overdue appearance of the mosaic online at a resolution where you can read all its detail is such a reason for celebration. Explore it and enjoy.

Avî-Yônā, Mîḵā’ēl. The Madaba Mosaic Map: With Introduction and Commentary. Jerusalem: Israel Exploration Society, 1954.

Donner, Herbert. The Mosaic Map of Madaba: An Introductory Guide. Peeters Publishers, 1992.

Donner, Herbert, and Heinz Cüppers. Die Mosaikkarte von Madeba: Tafelband. Wiesbaden: Otto Harrassowitz Verlag, 1977.

Palmer, Paul, Hermann Guthe, and Deutscher Verein zur Erforschung Palästinas. Die Mosaikkarte von Madeba. Leipzig, Baedeker, 1906. http://archive.org/details/diemosaikkartevo00deut.

2018-02-17

Dead Monk Tweets

One of the more charming features of Twitter is its voices of the past, and a favorite of mine is Constantinus Africanus, who introduces himself thus: "Native Tunisian. Merchant-turned-monk. Medical translator (from Arabic) and editor. Cultural influencer. Died 22 Dec., before 1098/99."

To expand on that a little, Constantine was a Christian from Tunisia who spent the final part of his life as a Benedictine at Monte Cassino Abbey in Italy. As a translator of the medical greats, he helped change the course of primitive western medicine. So he does have an affinity with today's social media hepcats.

I can't understand how Constantine is still writing 920 years after his death, but it's possible he is getting social-media coaching from a digital humanities hero, Professor Monica H. Green of Arizona State University. So far Constantine has just 188 Twitter followers and he really needs a boost, considering all the hard work he put into making people well. So hop over to Twitter and follow him.

Incidentally, Constantine's work shows up in at least two of the seven codices digitized by the Vatican Library this week:
  1. Vat.lat.649, a 12th-century Haymo of Halberstadt: In Epistolas Pauli omnes on the epistles. Here's an initial for De Virginibus praeceptum:
  2. Vat.lat.2132 (Upgraded to HQ), Paul of Venice on logic
  3. Vat.lat.2416 (Upgraded to HQ), a densely written 14th-century compendium of mainly Arab medicine, including fols. 51v-55v: Constantinus Africanus, De stomachi affectionibus liber, cap. 1-25. eTK lists incipits: Abaseph id est puncti III; Alasef id est puncti rubei
  4. Vat.lat.2424, the Brevarium, a medical work, by Yahya ibn Sarafyun (9th century) a Syriac physician, known in Europe as Johannes Serapion
  5. Vat.lat.2441, medicines
  6. Vat.lat.2454, 14th-century compilation of translations by Constantine Africanus
  7. Vat.lat.2940, a 15th-century student's compendium with everything from Cicero and Pliny to Boccaccio
This is Piggin's Unofficial List number 150. Thanks to @gundormr for harvesting. If you have corrections or additions, please use the comments box below. Follow me on Twitter (@JBPiggin) for news of more additions to DigiVatLib.

2018-02-06

The Animated Tabula

The latest update to the Tabula Peutingeriana Digital Plot on my website almost doubles the number of animations, and for the first time shows, using movement, how text entries were misplaced during a copying process lasting from about 350 to 1200 CE.

This digital version has been renamed the Tabula Peutingeriana Animated Edition to reflect these enhancements. In most of the left half of the chart you can now see color-coded routes and the emendations to them which have been proposed over the past century. The emendations are made visible by hovering on or touching the pale yellow squares which serve as triggers.

These interpretative additions make the chart a good deal less confusing. Column rules have also been added so that it will be easier to compare this digital edition with Talbert's.

Also new online is a brief article describing the Tabula in the context of diagram studies. This differs from those encyclopaedia entries which put the Tabula's clues to Roman history in the foreground or those which treat it primarily as a source of information about ancient settlements and place names.

2017-11-07

Pit-bull Professor

One of the fiercest fights in the history of scholarship opposed two very different men: on the one side a charismatic school science teacher - on the other, a university professor with a grudge.

A polymath who got his high school students to help in his research, Konrad Miller (1844-1933) introduced the German public to mappae mundi and the Tabula Peutingeriana, a Roman-era world chart. His celebrity seems to have personally offended Wilhelm Kubitschek (1858-1936), a numismatist and professor of ancient history at the University of Vienna, Austria. (Does anyone have photographs of them?)

Today, Miller is recognized as a founding father of cartographic history studies. He is still famed for a lithographic reproduction of the Tabula and Itineraria Romana, a massive 1916 handbook of its content. Both are now in the public domain (but you need to go to Russia to get a copy of IR). Kubitschek's assault on Miller's oeuvre is almost forgotten, so over the past few days I have been digging up and annotating the two main reviews.

Miller had been a smart farm boy who obtained both holy orders and a science doctorate in geology. Living in an era when the Catholic Church had too many, not few priests, he earned his living from age 37 on the staff of a public school in Stuttgart, Germany and in retirement ran a pilgrimage-tourism business.

Kubitschek, a student of Gustav Hirschfeld, had also been a schoolteacher before becoming chief of the royal Austrian coin collection and gaining his chair. In his pit-bull attack on Miller, it's possible to read habitual spite, or the defensive attitude of many old-time institutional academics towards amateurs and popularizers, but I suspect some kind of personal disappointment was the real driver of his feud, which went on for decades, according to Gerhard Winkler's biographical  note.

In 1902, Kubitschek had published Eine römische Straßenkarte, (DOI 10.11588/diglit.31257.7), a speculative analysis of the Tabula that was partly dire and partly ahead of its time, arguing the Tabula had nothing to do with an imperial frieze in Rome, the Agrippa Mural, and was possibly created as a private project. Perhaps he had vainly hoped for a commission to produce a new Tabula edition.

As it happens, the Peutinger Chart section of his mature 1919 article on ancient maps for the Pauly-Wissowa encyclopaedia was finally digitized just two weeks ago by Wikisource: read it now, though it still needs a second proof-read by a German-speaker.

It would have angered Kubitschek that outdated ideas were gaining fresh currency through Miller's best-selling publications. Miller, on the other hand, also had his work and a public life and was clearly not interested in avante garde theory: he thought entrepreneur-style and wanted to get a cheap facsimile and handbook on the market before his health declined.

He does reply to the fulminations of Kubitschek and other opponents, but gives them little space. Kubitschek, on the other hand, must have spent months marshaling his arguments against Miller in two enormous infinitely detailed reviews totalling 160 pages and complains he was denied more space that he needed to list Miller's failings.

I have annotated the two articles in English for those who don't read German or value a quick guide to what the feud was about. The title is: Explained: Kubitschek's Feud with Konrad Miller: A Manual. I have just uploaded this compilation to Academia.edu as one of my series of manuals.

The two texts are in the public domain. I thank the institutions which provided them and have made only fair use of them in my manual.

While much of Kubitschek's 1917 assault now seems petty, overblown and nasty, he is a century ahead of his time when he lays out what a proper new edition of the Tabula ought to provide (in addition to the best possible imaging, a transcription to the highest standards and a palaeographical analysis):
  1. It should convert all TP labels to modern script (a desideratum first achieved 100 years later in my own digital edition, 2017), minutely showing where all vignettes and rivers are placed;
  2. A critical analysis must be devoted to the scribal omissions of lines and the TP duplications (a difficult topic where we are not quite there yet);
  3. A graphic reconstruction is needed: he apparently means a geographical visualization of TP routes with a scale map as basis, a need only met in the 21st century by the Barrington Atlas, the Digital Atlas of the Roman Empire and OmnesViae;
  4. Good indexes (i.e. search tools) are required, a need met since 2010 by the Talbert Database.
There's one more thing. The best news we could have would be the rediscovery of the Michael Hummelberg drawings of the Tabula as it was in 1526. They were last seen a century ago in the Museo San Martino in Naples (Codex R 35). Will they ever be found?

Hirschfeld, Gustav. Review of Weltkarte des Castorius, by Konrad Miller. Berliner Philologische Wochenschrift 8 (1888): 624–34.
Kubitschek, Wilhelm. ‘Bemerkungen zu Konrad Millers Itineraria Romana’. Zeitschrift für die Österreichischen Gymnasien 68 (1917): 740–54, 865–93.
———. ‘Eine römische Straßenkarte’. Jahreshefte des Österreichischen Archäologischen Instituts in Wien 5 (1902): 20–96.
———. Review of: Konrad Miller, Itineraria Romana, etc., by Konrad Miller. Göttingische gelehrte Anzeigen 179, no. 1–2 (1917): 1-.
———. ‘Karten’. 1, X, 1919. https://de.wikisource.org/wiki/RE:Karten.
Miller, Konrad. ‘Die Weltkarte des Castorius genannt die Peutingersche Tafel (= Castori Romanorum cosmographi tabula quae dicitur Peutingeriana)’. Ravensburg: Otto Maier, 1887. http://archive.org/details/Tabula_Peutingeriana_complete.
———. Itineraria romana. Stuttgart: Strecker und Schröder, 1916. https://catalog.hathitrust.org/Record/000968347.
———. Rekonstruierte Karten. Vol. 6. 6 vols. Mappaemundi: die ältesten Weltkarten. Stuttgart: Roth, 1898.

2017-10-24

Breaching the 15,000 barrier

Today, the tally of online manuscripts at the Vatican Library ticked past 15,000. It's a moment to savor, like the DAX stock index surpassing 13,000 this month, but with a difference. Investments can go down as well as up. Virtual libraries only go up.

How did we get here?

In early 2014, the years of dismal efforts at the Vatican to create an online manuscripts portal had nothing much to show. The DigiVatLib site at that time was a hand me down. It indexed a few hundred manuscripts which had in fact been scanned for Germany's Bibliotheca Palatina Project, mainly funded by the Manfred Lautenschläger Stiftung, and copied to Rome for free.

The site only offered 24 items from the Vatican Library's other collections. Bear in mind that this was the world's biggest manuscript library, with more than 82,000 handwritten books in the vaults.

On March 20, 2014, a news conference announced a new contractor for digitization, NTT Data, a Japanese software company. It was an historic decision, because this professionalized a project that had been dogged by incompetence, and made it more attractive to wealthy donors who expected to see results for their money. NTT Data Italia did even more. It put up seed money, tossing in a whopping 18 million euros of its own, nominally to digitize 3,000 named manuscripts up to 2019.

Experts could thus be hired and servers bought. The fact that the tally of digitizations on the site's front page is now 15,000 presumably means that other funding has been added to the mix, although the Vatican Library does not publish income data. We do know that the Polonsky Project came in with about 1 million euros to digitize Hebrew and Greek manuscripts at the Vatican, work that ended last month. Mellon pitched in 563,000 dollars this year, but for metadata, not digitization.

The pace has kept accelerating. In May 2015, the manuscripts portal managed to surpass 2,000 items, and on November 3, 2015, it breached the 3,000 barrier, making it the biggest digitization program in Italy, overtaking the Biblioteca Medicea Laurenziana in Florence. During 2016, the portal doubled in size.

In January of this year, the program ballooned from 6,000 to 10,338 items overnight by an expedient. Much of the manuscript collection is backed up by old-fashioned black-and-white microfilm and some of these films had been scanned at client request, so these digital scans were placed online. These low-resolution images are a stopgap while high-resolution color scans of the same codices are being carried out.

The fact that we are now at the 15,000 mark indicates the project is not only in the finest of health, but also scores as probably the biggest manuscript portal in the world, though firm comparative data is hard to come by.

A search of the French national site Gallica for "manuscripts" with dates before 1600 produces 20,475 hits, but a significant number of these are single-page items. In Spain, the Biblioteca Digital Hispánica shows 15,971 manuscripts online, but the number sinks to 10,716 if you filter out post-1600 dates. Munich's Digitale Sammlungen shows about 5,300 digitized manuscripts earlier than 1600, whereas Manuscripta Mediaevalia, a portal which consolidates many of the German and Swiss repositories (including Munich, but not other centers), shows 13,340 digitized "manuscripts" online, but only 5,954 dating before 1600. Italy's Internet Culturale claims 19,426 online pre-1600 manuscripts at Italian libraries (not the Vatican), but this is full of duplicates. Of the total, 18,284 hits represent just 3,000 codices at the Biblioteca Medicea Laurenziana in Florence.

To summarize, and this is only an informed hunch, the current size of the four biggest national virtual libraries, counting just codices (multipage books) from before 1600 only, may be:
Vatican:12,000
France:11,000
Spain:11,000
Germany:6,000

What remains to be improved? My first beef with the portal is its slowness to download. The biggest single collection, Vat.lat., now offers nearly 4,000 manuscripts with 4,000 fiddly little thumbnail pictures coming down the pipe at you in one unwieldy page. There is no URL leading to a text-only main-site index of Vat.lat. Please, DigiVatLib, break up the Vat.Lib. table of contents into several sub-collections: 1-999, 1000-1999, and so on.

A second desideratum is to digitize the hand-written catalogs from the Vatican Library's Sala Consultatione MSS. These hand lists are not only vital as finding aids to the collections. They would provide provisional descriptions for the many manuscripts that go online with no metadata whatever. And these hand-annotated  books are historic documents of world rank in their own right. As long as these are withheld from virtual users of the library, there can be no pretence that use of the portal is as good as going to Rome in person.

2017-10-20

Italy in Color

I've made some major improvements to the Tabula Peutingeriana Digital Plot. Version 0.64 is the result of several weeks' tinkering at my desk. The three most visible changes are:
  • Color coding of the routes in Italy
  • Nearly 30 new animations of emendations
  • A CC BY-SA Creative Commons licence.
Coding Italy was a precondition for a detailed analysis of how the peninsular part of the chart -- the oldest surviving detailed "map" of the world, now a UNESCO Memory of the World treasure -- was drawn. I'll have more about this analysis for you soon.

The animations help you to visualize the original design, before the scribal miscopyings which litter the surviving manuscript, penned in the (long) 12th century. Most of these re-connections were proposed by Konrad Miller and Richard Talbert and are fairly widely accepted. Visualization, in my view, is better than a textual definition when one wants to make the graphic differences clear.

The licence is important because I am urging others to continue with my line of work. You are welcome to remix and alter the SVG plot for your own research, provided you leave my name attached.

Under the hood there are some technical advances specially invented for the chart:
  • The file size was reduced by 200 KB using a script that reconstitutes Talbert Database links on the fly
  • Links are shown to be active with underlining and overlining
  • Targeted links such as http://piggin.net/svg/PeutingerPiggin.svg#e1087 light up the target name in red with enlarged lettering, like this:
Check my initial announcement of the project in March and my launch announcement in September for more details. My project was originally based on Talbert's SVG version (sample below), but in my view the Talbert work is in certain respects no longer adequate for contemporary research:
  • The Talbert team generously put their suite of SVG files online for free download, but the files are too large to easily manipulate on most home computers and have not as far as I know been updated in the past decade.
  • Talbert Map A (above) does not enable you to jump back and forth to place-name entries in the Talbert Database using hyperlinks.
  • Talbert's color coding mainly differentiated the characteristics of text marked alongside the route stretches, whereas my color coding distinguishes the individual itineraries making up the chart.
For my articles about the Tabula Peutingeriana, visit my Academia.edu online repository. I also have a page on ResearchGate.

2016-12-10

After We Die

One of the key features of humanities in the age of print was preservation of both creative works and scholarship about them by royal and university libraries and later by national libraries. The point is of course that we will all be swept away by death and only the greatest repositories maintained by the sole durable institution we know, government, can be relied on to preserve whatever scholarly progress we achieve.

In the age of digital humanities this all becomes more complicated, because the key productions are often owned by universities or commercial organizations. Who is acting to preserve those databases, or even the small local data collections in which so much scholarship is presented? It's not looking good.

Because I am a New Zealand citizen, some years ago I asked the National Library of New Zealand to preserve my scholarly website, Piggin.Net, and I have just been to see what they did about it. The web archiving unit crawled the website every 12 months until May 2015, and then seems to have stopped. I have made many changes to the site since then and this it not reassuring. Will they resume crawling?

At the same time I asked the British Library to preserve another website in which I publish English family and local history, Piggin.Org. Alarmingly, the BL crawls ceased in 2013, although I go into that site from time to time to update information, correct links and fix spellings.

[Update: the BL unit, the UK Web Archive, has promptly replied on Twitter: "We have continued archiving sites after 2013 but they are not currently visible on the website. We are working to rectify this."]

It occurred to me that the country where I pay taxes, Germany, ought to be providing this service too. There is a web archiving unit at the Deutsche Nationalbibliothek, but its performance is a disgrace for a great nation. One would assume that a Made in Germany site which does not use the top-level domain DE would need to be added to the DNB archive by hand. However if you read the basic facts page, you discover that (a) it is impossible at the present time to nominate a page for spidering, and (b) a saved page would in any case only be visible in the reading room. This absurdity is (c) justified as a legal matter. But if one wished as copyright owner to opt in and offer the DNB the express consent to put the web-archive copy online, one couldn't. See (a). A catch 22.

To add insult to injury, the link to the web archive collection, such as it is, is dead.

Some of my articles are preserved at Academia.edu and at ResearchGate.Net, but the preservation of my website in its final state after I die is only being assured by one organization, Archive.Org of the United States, with its Wayback Machine. Archive.Org operates on an opt-out basis, meaning it saves everything (including from Germany) unless you expressly ask them not to.

I am very pleased with their work, particularly the fact that they harvest my version changes every few months. (In fact I sometimes go to them to recover versions I have myself lost.) But it is alarming to know that in 2016, archival preservation of the internet is still being left to a single San Francisco foundation funded by donations. They have just announced that they will create an extraterritorial backup copy of their collections in Canada. They are asking for donations. I think it's a very worthy cause.

But I still regard it as uncertain that any university or foundation or publishing company can survive for the next 500 years. This work ought to be funded by our governments,of which most will, in the nature of things, survive the course.

2016-11-22

Digital Humanities

The introduction to my text-archaeology project has just been revised, and now I need your input on how I could make it even better. The site should be like the ruins of Pergamum, a place any literate tourist can explore unaided, enjoying the pleasures of discovery at every corner. Here's the new introductory text:
The fifth-century Great Stemma was probably drawn on a roll of papyrus of standard height (30 centimetres say) and at least as long as the bed you sleep in. My reconstruction proposal, the Piggin Stemma, obviously can't be viewed on a smartphone or any other digital device unless you move it around. So scroll left and right; zoom in to read words (and zoom out to see the full expanse); use the built-in controls.
... If the Romans had had computers, this is how they would have read their scroll-format books on them.

As an example of the digital humanities, the Piggin Stemma invites you to explore beyond first sight and enjoy the pleasures of discovery. This innovative chart was rebuilt with a coding language named SVG. It enables me to hide a guidebook in 12 overlays that remain invisible until you need them. ...

It's not a film. Once you are ready, you will have to tap some controls to make the interactive layers appear. Each right button makes a new effect visible: the corresponding left button makes the overlay go away. Try it. The overlay entitled "Damage" even includes an animation ... showing how roundels were moved. ...

A reassurance: you came here because you are attuned to graphic desígn and the psychology of visualization. You will see here hundreds of Hebrew names you may not know. I have translated them from Latin into English to make them less alien, but don't be overwhelmed by names or glosses. You are on a guided tour of an exotic place: late-antique graphics technology. Don't be sidetracked by the late-antique theology (unless that is your passion).

First up, just concentrate on how a fifth-century designer uses circles to visualize kinship and depict eras of time. The leftmost flag ... of each overlay offers you enough context to get started on your walk through this text-archaeology excavation.

If you like this new method of presentation, and I am sure you will, recommend the site to your friends. Send them [the] URL: http://piggin.net/stemmahist/envelopereconstructor.htm Don't send them a direct link to the SVG file, or they may get baffled.... Enjoy the tour.
Are my ideogram pictures above coherent? Does anything about the project puzzle you or remain unexplained? Do you have any other digital humanities examples you can point me to that present historic charts interactively with overlays? One way to reply is to use the comments box below.