Showing posts with label Stemma. Show all posts

2019-01-05

All the Isidorian Bibles Online

A very special set of medieval bibles is complete at last, thanks to the recent digitization of the Foigny Bible in the French National Library, some of the best news of last year for codicologists.

These rare Vulgate bibles, one from Burgos in Spain and three from the Meuse Valley on the Franco-Belgian border, offer the sole surviving evidence of a shadowy struggle over belief in seventh-century Visigothic Spain.

Four years ago, I celebrated the arrival online of the Floreffe Bible (now in the British Library). Now the fourth and last is there to appreciate, the Foigny Bible, thanks to the Polonsky Foundation funding a project to virtually unite treasures of London and Paris that belong together. The illuminations in the Foigny Bible (here the Nativity) are wonderful:


Here are links to the whole set of four:

The Foigny Bible starts off with a prologue set which is found in the others too, a fairly sure sign that all these 11th and 12th century bibles derive from a much earlier model:
  • an arbor consanguinatis;
  • the Great Stemma, with a 6,000-word epitome of exegesis by Isidore in the blank spaces;
  • the Prologus Theodulfi
  • a second Prologus (Stegmüller, Rep. Biblicum, n° 284).
  • a second Prologus (Stegmüller, Rep. Biblicum, n° 285).
  • a capitula
And what were the Visigothic Christians arguing about? Whether St. Joachim, the supposed grandfather of Jesus existed! 


A late-antique "family tree" of Jesus, the Great Stemma (above), had been spreading through Iberia in the seventh century and it showed a legendary sheep-farmer, Joachim, in pride of place. Isidore of Seville thought this claim was nonsense. We don't know if Isidore himself altered the chart, but someone very smart and aligned with Isidore's thought took pen and rewired the "tree", cutting out poor Jo like a gastric bypass.

As for the 6,000 words of Isidorian Exegesis written in the gaps, you'll  have to make up your own mind who wrote it. Maybe that was Isidore too? Since it had never been identified or published previously, I edited the text some years ago.

2018-11-05

Mind's Eye Has Been Published

When were family-tree diagrams invented? My new book, Mind's Eye: How One Ancient Latin Invented Our Way to Visualize Stories, uncovers the progenitor of today's graphic timelines and trees in an ancient three-meter-wide chart of history.

Hidden in plain sight, the Great Stemma -- a Roman masterpiece -- has never been honored at book length before.

The Great Stemma was not only a vast visual abstraction of the march of time from Creation as far as the birth of Jesus Christ, but also marked a swerve in civilization towards exploiting our visual perception as an extra tool for thinking.

I argue that diagrams and visual displays exploit the computing power of human vision to short-cut our reasoning tasks. Cognitive science is only now able to grasp what a major shift in human culture this was. My research places that creative leap in the ancient world.

I foreshadowed Mind's Eye two years ago (when the book's working title was "Expositor" and I was still following up some loose ends in the inquiry). Since then, I have added some great cover art (the theme comes from Neptune's Necklace, a wondrous seaweed from the South Pacific) and converted the manuscript to e-book format. A print version may follow.

Here's the link which leads to stores where you can buy Mind's Eye at a low introductory price: https://books2read.com/PigginMindsEye (to which I add a modest plea: buy from one of the non-Kindle stores, where the price to you is the same, but I get a bigger royalty!)

Mind's Eye can be read rapidly, by skimming the 117 illustrations and checking out the QR links. Or it can be savored as an 88,000-word narrative in which I narrate how I brought this neglected graphic to light.

2016-12-20

Time Trials

Regular readers of this blog will know that a big topic hereabouts is the origin of timelines generally, and in particular how humans got the idea of construing synchronous series of events graphically by picturing them on parallel horizontal tracks.

Here is how it is done in the fifth century in the Great Stemma, with a track at top representing kings of Judah, at centre kings of Samaria and below it, the ancestors listed by the Gospel of Luke:


It is helpful here to use certain fundamental cognitive distinctions laid out by Rafael Núñez and Kensy Cooperrider not long ago in a review paper.

Humans can use (abstract) space to map the passage of time in three distinct fashions in their gesture and speech: projecting deictic time (from where "I" stand), setting an order of events in sequence time (distinguishing the placement of "landmarks" in time), and comparing one or more temporal spans. Scholarly discussions of time sometimes muddle these. As two authors remark:
Philosophers, physicists, and cognitive scientists have long theorized about time –along with domains such as cause and number – as a monumental and monolithic abstraction. In fact, however, the way humans make sense of time for everyday purposes is, as in the case of biological time tracking, more patchwork.
There is no reason to suppose that this typology in the mind transfers easily to a drawing. In fact, the two authors point out that investigating space-time mappings in non-English-speaking cultures by asking people to demonstrate with cards and paper may be handicapped by the fact that this "material realization " needs to itself be learned first:
... arrangement tasks are not well-suited for use in such populations, because they presuppose familiarity with materials and practices that, in fact, require considerable cultural scaffolding.
A similar point was made 20 years ago by Mary Bouquet, who rebuked anthropologists for asking Portuguese people unfamiliar with stemmata to draw their kinship bonds this way.

So what are the tracks in the Great Stemma doing? They don't tell us anything about the Latin concept of deictic time (though that has been very expertly figured out by Maurizo Bettini, who shows the Romans faced the past with their backs to the future), whereas the three tracks seem to demonstrate a Latin tendency to set out a sequence of time from left to right, in accord with the Latin writing system, and they do indeed suggest that Latin-speakers would have compared durations of temporal spans in a spatial way when speaking of them.

It could well be argued that the invention of this type of timeline was inspired by gesture, though I have considered other origins such as game-play. The spans are not exactly calibrated with one another, but match one another in lengths more precisely than a speaker would ever intend to do in gesture.

An intriguing aspect of the Núñez and Cooperrider paper is its mention of the spiral of time perceived in some cultures. The Great Stemma might have something going on in this respect where it loops up at the end and flips, with the script gradually rotating and terminating in a plaque with several upside-down sentences:


These are all aspects that require further study and analysis.

Bettini, Maurizio. Anthropology and Roman Culture: Kinship, Time, Images of the Soul. Translated by John Van Sickle. Baltimore: Johns Hopkins Univ. Press, 1991.

Bouquet, Mary. ‘Family Trees and Their Affinities: The Visual Imperative of the Genealogical Diagram’. Journal of the Royal Anthropological Institute 2, no. 1 (1996): 43–66. doi:10.2307/3034632.

Núñez, Rafael, and Kensy Cooperrider. ‘The Tangle of Space and Time in Human Cognition’. Trends in Cognitive Sciences 17, no. 5 (2013): 220–29. doi:10.1016/j.tics.2013.03.008.

2016-10-23

Chart Before Jerome

Before Jerome of Stridon produced his revised Latin version of the Christian Bible in about 400 CE, the version that remains in use today, a Latin edition by translators unknown had existed and had been in wide use. The Great Stemma, the world's oldest network diagram, is product of that culture.

My new reconstruction of the Great Stemma appeared several weeks ago, initially in an English translation. Hot off the press today is an update containing the Vetus Latina or Old Biblical Latin text.

Seeing the chart reconstructed to the original shape is amazing enough. Seeing it in its original language from the time before Jerome adds to the verisimilitude. We don't know exactly when the Great Stemma was made. It was certainly before 427 CE. If it was not made before 400, its ignorance of Jerome's work is in no way surprising. It took centuries for the Jerome Bible to establish itself.

Flipping text upside-down and making it land dead centre in every circle or roundel were among the challenges in the initial reconstruction. One of my difficulties this time round was squeezing these Vetus Latina labels, which mostly take the stereotypical form of "Salomon filius David" (Solomon son of David), into the roundels.

It helped to adopt a condensed/narrow font (CSS: font-family: "Arial Narrow", "Helvetica Condensed", Arial, Helvetica, sans-serif;), but many of the labels still burst the confines of the circles. In a handwritten chart, you used to be able to vary the text size or squeeze it close together, or split words in unconventional ways. With modern, regularized, typographical text, that is hardly possible, and I did not want to make the text any smaller or it would not have given the impression the chart used to make, so I have allowed labels to spill when they are too long. Tell me what you think.


2016-10-01

Secret of Oldest Infographic Revealed: A Grid

Things have been quiet on this blog and my Twitter stream because I have been working on a major project: a complete reconstruction of the oldest known conceptual infographic in the world: the fifth-century Latin Great Stemma.

When I first announced its rediscovery in 2011, I presented a rather freely drawn plot of it (see this in my article in Studia Patristica or archived on my website as an swf (Flash) file):

This time round, I am trying to do something much harder: to replicate the chart without any accommodations to modern assumptions, showing it precisely as it was intended by its designer.

The result (link) is the layout that the designer would have saved if the SVG mark-up language had existed in the fifth century. Not only are the lines, circles and text in the precise locations where the design called for them to be positioned. These positions also allow us to observe the design's hidden concepts and rules. This new drawing is not an impression of the late antique original: it is an encoding of the design itself.

The starting point for my revision was wise counsel from a great infographics teacher and practitioner, Raimar Heber of Germany. Raimar has just published a textbook (in German, Rheinwerk Verlag) of best practices in infographics and it looks very good indeed from the page samples.

In 2011, Raimar offered to do a retro-engineering experiment: he world accept an imaginary design brief and visualize the data of the Great Stemma as one of the world's leading professional art editors would design it today. He drew up a graphic sampler. One frame of it pitched a grid as the basis of the visualization. Chains should be laid out in the horizontal and vertical, he argued, with shoots allowed at 45-degree angles if the going got tough.

For a long time, I was sceptical about this. It sounded too 21st century to me. There is only one manuscript of the Great Stemma where straight lines and right angles stand out (Plut 20.54 in Florence), but one tends to assume that was just the obsession of an over-neat scribe.

But in spring this year I began re-analysing every substructure of the Great Stemma using a selection of the best manuscripts. This involved no less than 30 separate investigations, listed here as a "detail views".

For the first time I noticed something.

The manuscripts contain many vertical columns of roundels (the circles containing names). If one counts how many members there are in such rows, one comes up unusually often with the number 10. There might for example be a column of eight connected roundels, in a place where two others above them block the area overhead. Or there are long chains which bend to the left or the right at the 10th member in many manuscripts.

So as an experiment I worked to trim all 100 of so columns of the Great Stemma so that each was 10 elements high. If you array that many columns side by side it naturally appears gridlike.


This alignment became a new paradigm. Not only is this pattern harmonious, but it also provides a simple and logical explanation for so many bulges, interlocks and elbows in the manuscripts. I am convinced it is the lost original pattern that the designer used. So Raimar's insight turned out to be spot on.

On reflection there would have been good reasons to use a grid. Firstly, it makes designs easier to read. That is an imperative of then and now.

Secondly, it makes a design much easier to hand-copy, which is no longer an imperative now, but was an important concern before the rise of printing. If you draw a grid where the written data expand neatly in two dimensions, and prescribe moreover that certain squares be left blank, you have a robust model for copyists to work from. We should study whether a similar method may have been used to copy the Peutinger Table, mappaemundi and other late antique charts by hand.

Take a look at my new reconstruction, which translates all of the 5th-century design into a (gridlike) pixel coordinate system. This design is not drawn by hand, but as output from a new database I have built, where all the crossing points in the grid have been recorded, along with the roundels, texts and connectors that pertain to those crossings. Other scholars may offer their own editions in future, but I would argue that the Piggin Stemma is the most accurate reconstruction on the available evidence.

A contemporary buzzword is digital humanities, which often is simply watered down to mean storing and searching old documents as scans in databases. True digital humanities work is something more: it means recasting historic creative work from its original analog expression to a digital expression which remains absolutely congruent with the artist's or writer's intentions, but yields more insight.

I have tried to make this chart even more accessible by translating its text into English and by supplementing it with explanatory plaques and interactive visual effects (look for radio buttons like those above). Tell me if it works like this and how you think it might be further improved.

2016-07-08

What's It About?

I get asked: what's your book's title, and what's it about?

The working title is: Expositor. The project investigates the world's oldest information visualization, a 3-metre tree diagram drawn up in the Roman Empire. This chart in Latin which sets out biblical genealogies from Adam to Jesus, intertwined with threads of Jewish political history, has been hidden in plain sight for centuries and has never been examined at book length before.

The original chart is now lost, but medieval copies allow us to reconstruct how this diagram might have looked. Its historic title is unknown, so it is nowadays code-named the "Great Stemma" (GS). You can see a provisional reconstruction of it online on my website, which serves as a long-term data-dump for my research (and is not especially easy to read).

The book will a good read. Using a narrative in the style of a documentary film, Expositor meets with investigators, proceeds from clue to clue, skirts dead ends, and climaxes at a solution which reveals  the origin of the GS. As the story unfolds, it emerges that the chart is five centuries older than previously thought, probably drawn with disciplined skill and careful design in about 420 AD.

Expositor will propose that the GS was inspired not by maps or geometry, but by board games and the abacus, and relates how it was the progenitor of a 16th-century craze for genealogy as well as a remarkable Chinese chart, along with all our modern trees, timelines and mind-maps. The book culminates in a discussion of what it means to visualize information.

The Roman-era chart effectively invented a new technology, leading up to the graphic user interface used in every touch-screen today. I argue that diagrams and visual displays exploit the computing power of human vision to short-cut reasoning tasks. Cognitive science is only now able to grasp what a major shift in human culture this was. My research places that shift in the ancient world.

2016-05-24

Old and New

A bit of fun this week, comparing diagrams old and new in the spirit of plus ca change ...

1

Here is Cassiodorus (6th century) using a decision tree in legal reasoning. This has been translated for your reading pleasure, but you can check out the original in Latin too.


And here is Ahmad Farouq (21st century) explaining the legal doctrine of negligence in Commonwealth jurisdictions in a remarkably similar stemmatic diagram that proceeds downwards, then left to right, quoting key words and key cases:


2

Here are the tribes of Mount Seir (in modern Jordan), who were perceived as having ancestral affiliations among one another by the authors of the Book of Genesis. They probably were tribally related, though not through eponymous ancestors as claimed here. The 5th-century author the Great Stemma diagrammed them thus:
A modern scientific approach is to build phylogenies among cultures based on language characteristics. Here is a diagram by Michael Dunn et al. on language groups:

These old and new diagrams show that although the form and sophistication of infographics has advanced enormously in the past century, the principle of visualization and its uses has deep and ancient origins.

2016-05-15

Medieval Diagram Commentary Rediscovered

Rediscovering a lost medieval work is the dream of many historians. It has come true for me in the last few weeks as a 6,000-word medieval commentary on a late antique diagram has emerged in my research. For 150 years, medieval manuscripts of Europe have been sifted and catalogued, but sometimes a big fat chunk of writing escapes the scholars' notice. Until now.

This little opus is not easy reading: a Latin commentary which contends that stories in the Old Testament of the Bible foreshadow the life of Christ and the history of the Christian church. What is wonderful about it is its reflections on data visualization, a topic that directly concerns web designers, educators and scientists today.

The commentary is written in gaps of the Great Stemma, a huge 5th-century diagram of biblical history and genealogy (reconstruction here), where the story proceeds from Adam at left to Jesus at right.

The commentator notes that the genealogy of the Gospel of Luke "is laid out like a builder's line in the hand of the Father", which makes sense if you look at the drawing:


The line is a string (funiculus) that a bricklayer pegs out to set a line of bricks to, and that's an interesting comment. A line of data, also described with another Latin word for a string, filum, is the fundamental unit of data visualization, whether it's a series of nodes in a network, an axis on a graph or dates in a timeline.

The commentator also quotes Gregory the Great (c.540– 604), a writer who is a pre-eminent late antique source on visualization. Gregory was interested in omnivision, the all-seeing view.

Gregory has a section (18.46) in Moralia in Iob where he disparages wisdom composed only of eloquent words (quam sunt verborum compositionibus) and contrasts surface perception (ante humanos oculos) with divine perception. The implication here is that you see things more truly in a diagram than when they are wordily explained. The commentator has quoted this passage in full in the opus.

You can read the full transcription of the rediscovered Latin document on my website (sorry, I cannot translate Latin, but the passage from Gregory can be found elsewhere in English (scroll down to [xlvi]). I have provided links from my transcription to the digitized manuscripts.

I can't yet tell you who the author is. Much of the little opus consists of quotes from the Expositio/Quaestiones in Vetus Testamentum by Gregory's contemporary, Isidore of Seville (560-636), so it could even have been composed during Isidore's lifetime.

How did the document emerge back into the light of day? Like so many good things, it was hidden in plain sight. It is copied in four well-known 12th-century grand bibles: the Bibles of Parc, Floreffe and Foigy (all from monasteries in the Meuse valley) and the Romanesque Bible of Burgos in Spain. Three of them are online, so that counts as very plain sight.
The epitome of Isidore is in the chunks of text at the bottom of this sample spread from the Parc Bible.

As a wise observer commented to me, philologists probably overlooked the work because it is written in the gaps in a drawing. Scholars generally expect a serious work to appear in a manuscript as slabs of text, not interlaced with a genealogy. The key difficulty in disentangling the text was to determine which bits are the Isidorian enthusiast's commentary and which bits have other origins.

Four strata in the development of the diagram as you see it above can be distinguished.

The underlying diagram, containing 540 names written in connected roundels and extending the length of a papyrus roll, was devised by an anonymous patristic author to demonstrate the flow of Old Testament history and to reconcile a conflict between the genealogy of Jesus offered by the Gospel of Matthew and that laid out in the Gospel of Luke.

The original state of this lowest layer is witnessed by a manuscript in Florence (Plut. 20.54, 11th century). Its date prior to 427 and its extent is documented by a text known as the Liber Genealogus. The Great Stemma, as I call it, is the only known large Patristic diagram. As evidence of data visualization in western antiquity, its importance is only surpassed by that of the Peutinger Table of highways of the Roman world.

The Christian diagram, of which 25 witnesses including the four bibles survive, is known to have initially circulated in early medieval Spain sub-sectioned into 18 codex pages.

In one fork of its development, its solution to the contradiction between the Gospel genealogies was anonymously altered to conform to a theory by Julius Africanus. The Latin translation by Rufinus of the essence of that proposal was appended. This is the second of the strata in the version we are concerned with here, and is witnessed solely by a text-only abstract in the Bible of Ripoll at the Vatican (Vat. lat. 5729, 11th century).

Imbued with the spirit of Isidore, the epitomizer later implanted the bible commentary on that surface. He or she entered many notes in the blank spaces to lay down a third stratum.

In a final development, an editor, perhaps a northern European in the mid medieval period, prefaced the main diagram with an arbor consanguinatis figure and a brief text associating the diagrams with one another as symbols of Christ's cross. This fourth stratum, seen only in the three Mosan bibles (mid 12th century), has been recently analysed by Andrea Worm and requires no discussion here.

Until we understand this stratification, we cannot recognize stratum three as a distinct entity. Only scientific investigation can extract stratum three from the matrix of words in which it has become fossilized. Scholars of Isidore will be excited at the emergence of this commentary, which contains the essence of the Expositio, at about one-twelfth of that work's length, since it illuminates the way the medieval world received and adapted the works of Isidore.

I have thought a lot about whether Isidore himself might have created this version, since it seems to me, from my own experience of a lifetime of editorial cutting, that it is easy to expand a text by inserting interlinear words and phrases while keeping its syntax, but difficult on the fly to abbreviate a handwritten text while preserving its syntax, as this epitome does.

That thought might lead one to the notion that this text could have been Isidore's own first draft. However I cannot yet see any definite evidence for that in the text. In fact, we cannot establish with any certainty where or when the commentary was written. I would tend to guess at 7th- or 8th-century Spain, but other scholars will have to take that issue on.

For links to the digitized manuscripts and literature, check out my web page.

2016-04-30

Greatest Brain Hack of All Time

Human beings are mostly quite good at remembering lots of faces. We automatically classify faces by shape and complexion. We mentally associate similar looking faces into families and groups. After seeing a face, we rapidly assign that person to a known category.

But if we only have strangers' names and can't see their faces, how do we begin to encompass who they might be and where they belong? Human beings are terrible at remembering multitudinous connections between abstract things like names or ideas. Without a visible presence, these are hard to grasp.

Oddly enough, storing and retrieving data about connections is a ridiculously simple task to design into a computer program. But for most people, it can take hours of reciting and revision to learn by heart how a hundred facts or words or values are interconnected. We are not built to do that well.

About 2,000 years ago, some very clever people invented a method to get around this issue. They looked for a mechanism in the human brain which operates in some other context to solve similar problems. To understand what they discovered, let's imagine we go to some beach resort for the first time.

In the first hour, you figure out the path down to the beach, recognizing some landmark you need to pass on the way, like a restaurant. You immediately note a couple of other landmarks like an especially ugly hotel and an ice-cream booth. As you walk around the village, you discover a caravan park behind the ice-cream joint and a bus-stop past the hotel. In time, you realize that the bus-stop is in a street which leads to a boat-hire place and out to the main highway.


What's developing in your head is a mental map full of branching connections. Now strangely enough, most of us can remember hundreds of landmarks and waypoints when we are out and about. We retain them much more easily than we remember interconnections between abstract facts.

So the solution devised back in the Roman Empire was a hack. If you pretend to yourself that abstractions are landmarks along forking paths, your innate guidance system will do the heavy computing work for you, and aid you to grasp the interconnections among the concepts.

All you have to do is draw a branching path, plant the facts along it, and then walk this path with your eyes. This is a drawing of the descendants of Leah, a biblical woman, as it was devised around the year 400. The manuscript you are looking at (Florence, Plutei 20.54) was accurately copied from it about 600 years after that.


You might look at this and think: OK, that's just a family tree. For us in the 21st century, diagrams where you walk paths with your eyes are common and unremarkable. But back then the invention was very new. It had not previously been realized that abstractions like a genealogy of three generations could be visualized in this way.

Because this hack was very new, the design had to respect where its readers were at. Nobody was yet educated in how to read these abstract diagrams. Readers only had their instinctive human ability to walk branching paths and find their way by landmarks back to where they started.

In our mental maps of the world, almost anything can serve as a landmark. Every waypoint has a unique appearance, but is similar in its function. So in the Roman abstract diagram, every node had unique content, but was standardized in its circular shape.

In our mental maps, it's easy to learn waypoints, but hard to learn bearings. We imagine the waypoints of every path as one behind another and we ignore slight changes of direction. So in a Roman abstract diagram, the nodes are arranged in straight lines with as few turns as possible.

This Roman diagram was only recently re-discovered. It's the only chart of its type to have been copied in the Middle Ages. It's now the only one surviving from antiquity. Because the Roman diagram is stripped down to the bare essentials, it shows the essence of how we learned to harness the brain to do something new: grasp abstract facts by treating them as if they were landmarks on paths.

This may be the greatest brain hack of all time, a kludge that's so good that we no longer even realize we are harnessing our guidance systems to do something they were not designed to do.

And because it was devised for a world that did not yet use visualizations, it provides valuable clues to how all mental maps work in humans, and indeed in most animals, and even in many insects.

We humans are not as good at thinking about abstractions as we pretend to be. But if we had not adapted our mental navigation machinery to help in the task, we would be far worse at it.

2016-04-02

Medieval scribes used HTML tags

When a video-rich website fails to load to your mobile because you drove out of cell range or your data plan maxed out, you're a victim of data bloat. To make files more portable, programmers constantly seek new ways to compress them in size. Now, it turns out, the problem was licked 1,000 years ago.

One way to compress a text file is to shorten its commonest words. Medieval scribes knew that. They had a long repertoire of abbreviations, but this only shortens a file by about 5 per cent.

A modern way is to deconstruct the document, and provide a web client with compact instructions about how to rebuild it. That's how a browser reconstitutes a page using bare-bones text in a HTML file, prettied up by the look, sizing and positioning saved in a CSS file. All the objects are instances of classes of some sort, so they don't have to be repetitively described.

The result: tiny files can create big, bright web pages.

This week I discovered evidence that medieval information technologists used the same technique, separating content from form to make a graphics file more portable.

The story starts with the Bible of Ripoll, a Latin bible illuminated in Ripoll, Spain in about 1025 CE and now kept at the Vatican. It contains a handwritten list of only the text of a late antique infographic, the Great Stemma. This huge diagram devised in about 420 CE generally needs up to 18 pages to display, but in the Ripoll Bible, the text-only version fits in a little over five pages.

The mystery here is: why was the Ripoll list made? What use is a non-graphic version of  a diagram? No one has ever been able to solve that puzzle about this manuscript. Let's look at a sample of the Ripoll text, where it quotes the Gospel of Matthew 1:4-5 "Nahshon was father of Salmon; Salmon was father of Boaz, ... Boaz was father of Obed, whose mother was Ruth. Obed was father of Jesse."

In the following image, I have circled five puzzling extra letters in the Latin text in red. After the initial capital of each name, the same letter in miniscule has been inserted. The letter with Salmon is the normal "s" in Carolingian script, while the "o" with Obed is damaged but clear enough. To exercise your grey cells, I have not marked the "i" of Jesse and the "d" of David. Try to find them.

For reading purposes only, these added letters would be completely superfluous. I've never seen the like of them. But after some thought, I believe I can explain the insertions.

In my view, this text-only file was not originally something that stood alone, but must have been intended for use in conjunction with a positioning document. I would conjecture that the document would have looked something like this in its section with the five generations to Jesse:

The small letters here match with the keys in the text file. The text has thus been divided into snippets, just as a HTML text is marked up with tags in modern web documents. Tagging is a type of metadata to describe a document's presentation. It relies on a set of definitions held elsewhere.

For the Ripoll document, which is not explained in any way, an explanation must have existed elsewhere as to what the reconstituted document was to be: a visualization of a biblical genealogy where the persons (and historical periods) were represented by circles. This would be the equivalent of a modern "document type declaration".

Using an exemplar composed of three compact files, any smart scribe would have been able to reconstitute the original diagram like this:

In this version, dating to about 672 CE and preserved in a later Italian manuscript, Plut 20.54 in Florence, the five names of the men are in the top row. Ruth's is the centre roundel in the lower row.

Why the proper diagram was never reconstructed and inserted in the beautiful Ripoll Bible (Vat. lat. 5729, still not online) is unclear. Perhaps its positioning file was missing or damaged. Perhaps there was a misunderstanding in the scriptorium.

Now I must emphasize I am not claiming Hyper Text Markup Language was devised in medieval times: I am using that term as an approximation for meta-data markup at the phrase level. Nor have I discovered the positioning document itself. I can only guess that it once existed. But I think we now have a cogent explanation of the function of these miniscule letters, and thus of the Ripoll list itself. Other parts of it have large initials in the margins (like the big O of Obeth above) which may have also been keys. I am not aware of any medieval or ancient source that describes this method of conveying a diagram, nor do I know of any modern scholar who has suggested such a bright idea was even possible.

But the idea makes eminent sense if one considers that parchment was expensive and copying the Great Stemma accurately (it contains about 540 names and is fiendishly complicated) would have taken a scribe four or five days. To have a master copy in this very compact form (the whole Great Stemma structure could be reproduced on the equivalent of two A4 sheets) which could be taken from place to place easily and used to make local copies matches what we know about ancient and medieval book production methods: that exemplars or master copies were relied on.

The use of metadata tags to do so is a major surprise and changes what we know about the origins of modern information science. It also suggests a method that might have been used to distribute other charts such as the Late Antique Peutinger Diagram.

2015-12-05

Stemmata in Incunables

What I have been looking at in recent weeks is how early printers coped with the idea of a stemma without drawing a tree. The period I am looking at is that of the so-called incunables, books printed before 1500, and I should stress that I am not concerned here with fanciful treelike art like that of Hartmann Schedel (as in the previous post) but with the pure stemmata.

The simplest approach in this period was to cut a pre-existing graphic as a woodblock, which is what the author and publisher did in Die Cronica van der hilliger Stat va[n] Coelle[n] (The Chronicle of the Holy City of Cologne, 1499, ISTC ic00476000 GW 6688). Here, each name is placed in a rectangular clipeus with curvilinear connectors.


A copy of this little book printed in Cologne has been digitized by the HAB. Although headed "Der Stam ind Ursprunck der Herzogen von Sassen", the graphic is in fact nothing more than a new version of the 1043 stemma by Siegfried of Gorze, which had been drawn to argue (in vain) the irregularity of Emperor Heinrich marrying Agnes of Poitou and was endlessly repurposed for the next five centuries:

The same book contains an adaptation of the Stemma of Cunigunde of similar age. These woodcuts are innovative in form, but do not advance diagrammatic technology in any essential way.

Strictly traditional stemmata could also be cut in wood, as in the 1475 Rudimentum Novitiorum where the roundel form is made chainlike:

The long-familiar pattern of roundels is set up as a block in this Seleucid genealogy in a 1498 edition from Basle of Nicholas of Lyra, once again imitating forerunners in the manuscripts, but with the change in this printing that the connecting lines are almost as wide as the roundels:

Slightly out of period is a 1511 Paris-printed Boccaccio Genealogy of the Gods (John Rylands Library copy), where the fanciful leaf-work of the Boccaccio autograph manuscript (1363-66) is dispensed with and roundels and little scrolls are used:
Much more creative and innovative is the early effort by the printers to build stemmata out of punch-cut type. These experiments had to be adapted to the type-form, the printing frame in which every element had to be rectangular so the form could be fitted and wedged before going to press.

The Chronica Bossiana printed by Zarotto at Milan (or Parma) in 1492 (ISTC ib01040000 GW 4952) has an extraordinarily modern-looking stemma which employs rectangles and straight connecting lines:


For a while I found it hard to believe this Genealogy of the Visconti was truly made this way, back in 1492. It would look absolutely at home in a modern PowerPoint presentation, and apart from the Latin and the typeface, it could grace any modern digitally composed book without anyone suspecting its age.

The Italian printer produced it in red ink in a book that otherwise is in black (in my plot, the print should therefore properly be red too) and pasted it in the front. Scrutiny suggests this may not be xylographic like the Cologne stemma above, but a composed typographic page using rules, though I am not expert enough to judge how these boxes and connecting lines could have been set up.

The author of this world chronicle, Donato Bossi (biography in Italian), paid for the printing, so he may well have had a hand in the design. You can inspect the page as printed and zoom in by consulting the Chronica Bossiana copy at the HAB. The University of Cambridge has another copy which is not digitized, but is carefully described, and I will quote that description:
[Genealogical tree of the Visconti family], caption "Geneologia uicecomitum Principum Mediolani descendentium de Inuorio Ducatus Mediolani", 1v; Donatus Bossius. Chronica, dedicated to Johannes Galeatius Sforza, duke of Milan.

Later, printers were to develop other options, such as using blank space to build a stemma. The table of figures of speech by Georg Major printed as a preface to Philipp Melanchthon's De arte dicendi at Leipzig in 1528 (and also at Paris in 1529, digitized at HAB), contains a stemma with no connecting lines at all:

But as far as I can tell at first sight, these minimalist stemmatic arrays are not yet found in pre-1500 printing.

2015-10-10

Rome and Qing Fuse in a 1704 Diagram

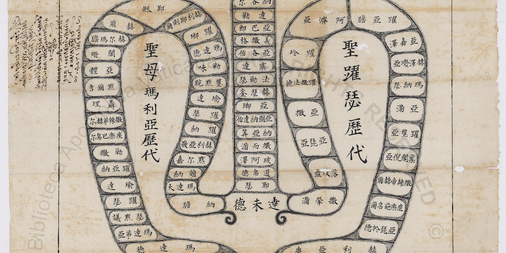
Just after 1700 CE, Chinese experts accepted an extraordinary commission: to devise a poster-sized infographic to depict the ancestry of Jesus Christ. Their help had been sought by Carlo Orazio da Castorano (1673-1755), a Franciscan missionary in Shandong, a city 400 kilometres south of Beijing.

The only known copy of the poster that the unknown Shandong designer/engraver and printer (perhaps assisted by an editor) produced is now in the Biblioteca Apostolica Vaticana in Rome.

This fusion of Latin late antique ideas and creative Qing-period design has a special place in world cognitive history. The poster is about 125 centimetres high. Several weeks ago, the Digita Vaticana, the digitization programme at the BAV in Rome, brought Vat.estr.or.55 online, as I noted at the time.

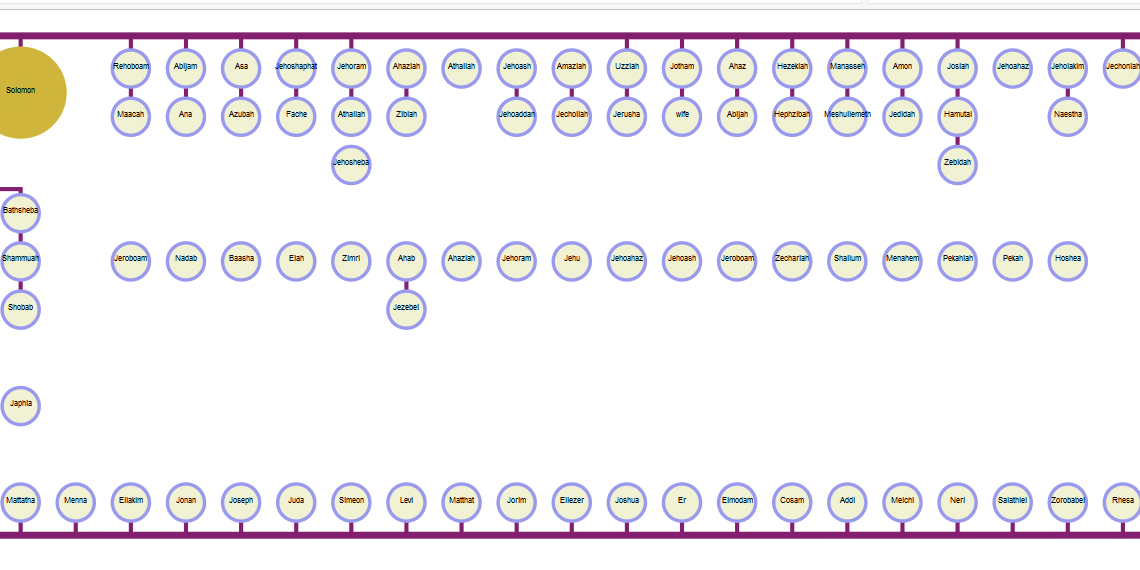
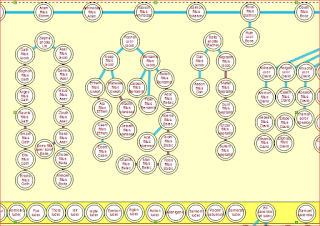
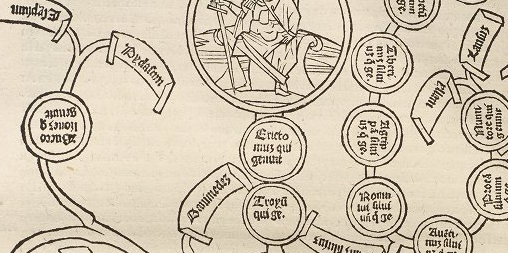
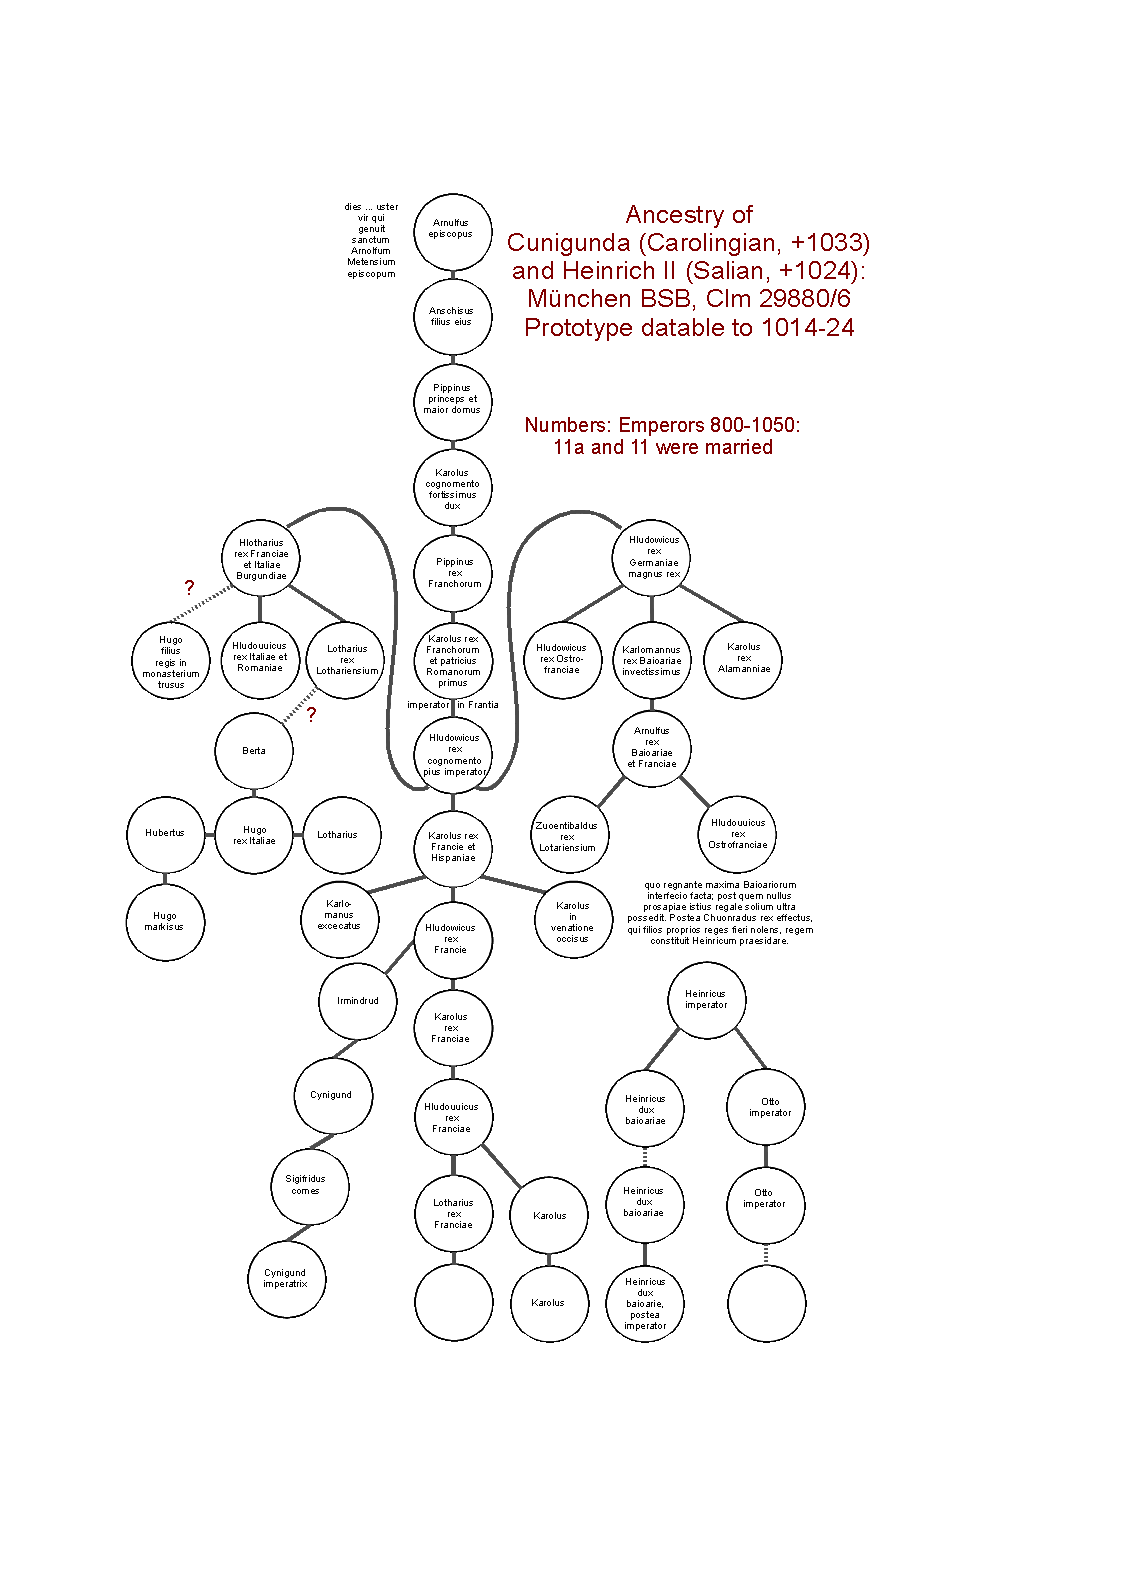
The poster published in 1704 shows a dual genealogy of Jesus, beginning as a single stream at Adam at top, dividing at David into the line of Nathan at left and the line of Solomon at right. The left loops comprise a genealogy according to the Gospel of Luke, and the right loops that in the 
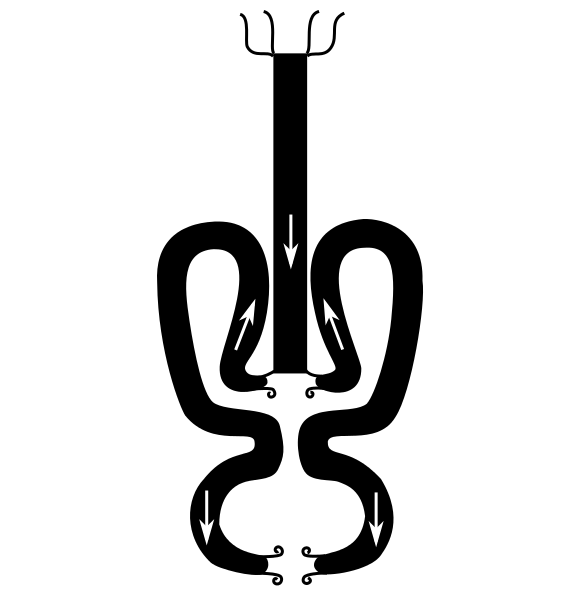
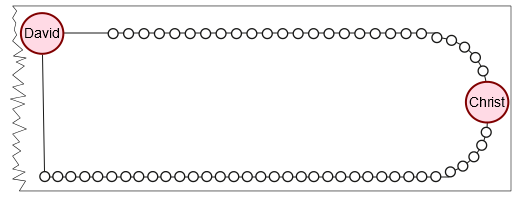
Gospel of Matthew. The overall shape ends up looking something like a guitar. Jesus occupies the gap at the base. Here is a schematic summary of it. The white arrows show the direction of descent:
What the diagram achieves in cognitive terms is this: It visualizes the genealogy of Jesus as a combination of flow-chart and network. What began as mythic stories and oral history among Jews is here translated from the linguistic sphere of knowledge into the visual-spatial sphere, where the reader is invited to comprehend it with a different cognitive system of the mind. In addition, the chart re-imagines all this in a Chinese cultural mode.

Orazio, whose Italian surname is also spelled as Orazi and whose Chinese name was 康和子 (Kāng Hézi), was just 31 and had barely been four years in China when the Qing artists or craftsmen accepted his briefing to make this extraordinary graphic. (I rely on Michela Catto's account of him in the Dictionary of Italian National Biography, and also notes by Michael Mungello.)

Although only Kāng Hézi and none of the other creative contributors is named on the poster, a modicum of post-colonial common sense suggests that while the basic idea was the young Orazio's, the execution, probably by directly engraving a metal plate, required much Chinese artistic and technical talent. Where Orazio would have requested European-style roundels and connectors like this ...
... the designer/engraver must  have persuaded him to instead accept cells, oval in shape, fitted together in a broad band:

The cells make eminent sense in a Chinese context. Their shape makes them recognizable as analogues of ancestral tablets. Their organization into paths might have seemed a little strange to a Chinese readership. The paths make the chart akin to a map. The diagram is termed a "tú" (圖) or chart, with the full title Wúzhǔ Yēsū jí tiānxià wànmín lìdài zōngpài tú (吾主耶穌及天下萬民歷代宗派圖) (Dudink).

The advantage for Orazio and his partners in setting the cells flush was that this ensured enough space for the names to be legible, while not making the poster any bigger than the largest commercially available paper sheets for printing in China. The compression of the main lines of ancestry into such a circuitous shape assists the illusion of equality between the lines of Luke (left) and Matthew (right). These aspects too may have been the engraver/designer's own idea, not Orazio's. Considerable effort has also been applied to softening the lines by composing them of tiny brushwork and by feathering all the line ends.

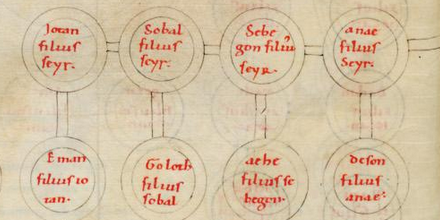
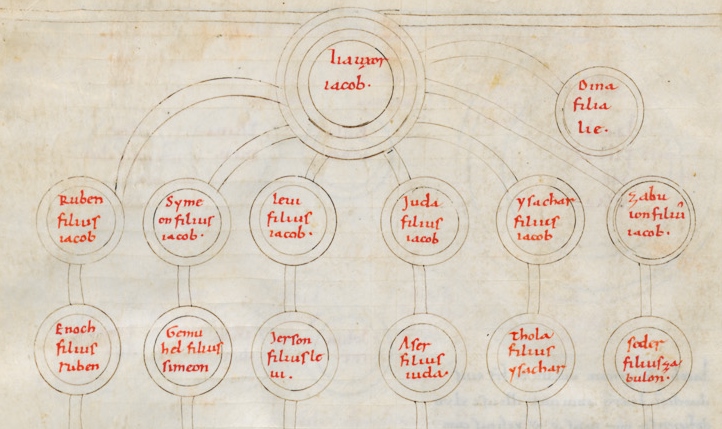
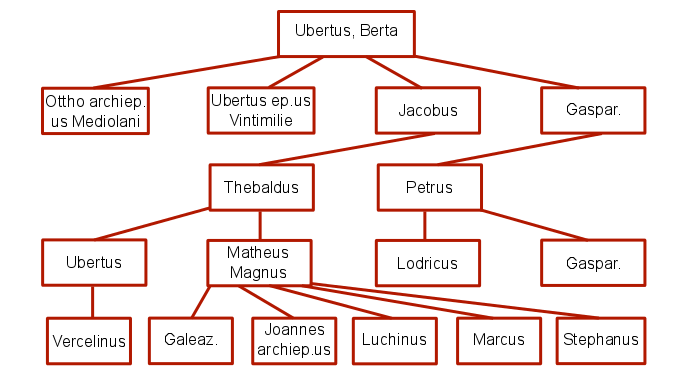
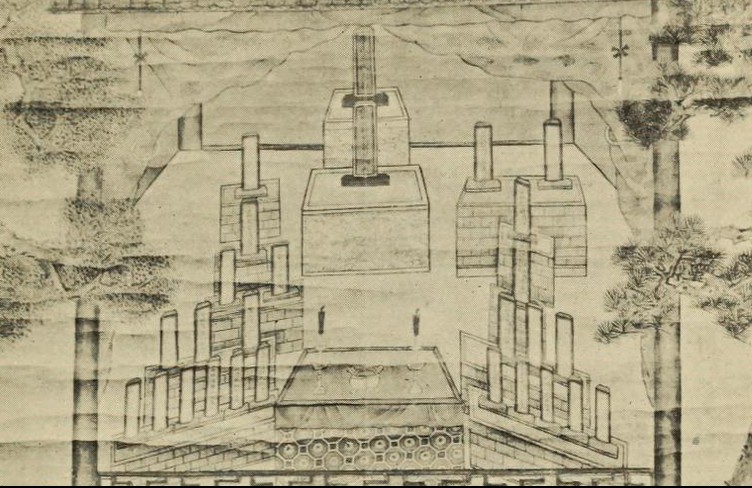
It is interesting to compare this diagram with an ancestral scroll of uncertain date collected in Shandong only 200 years after the Orazio diagram was made (quoted by Cohen from Johnston). This visualizes family as tablets arranged in a top-down stemmatic fashion, suggesting the Orazio diagram would have been readily cognizable for a northern Chinese audience as a genealogy:

Both China and the West had long histories of experiments with visualizing abstract information of hierarchical form for genealogy. A type of stemmatic chart known as a sū shì zōng tú pǔ (蘇氏宗圖譜) was invented in the Northern Song (960-1279) state while another style known as a bǎo tǎ shì tú pǔ (寶塔式圖譜) was popular in the Southern Song state (Chao).

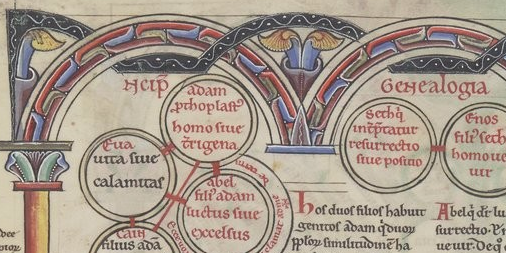
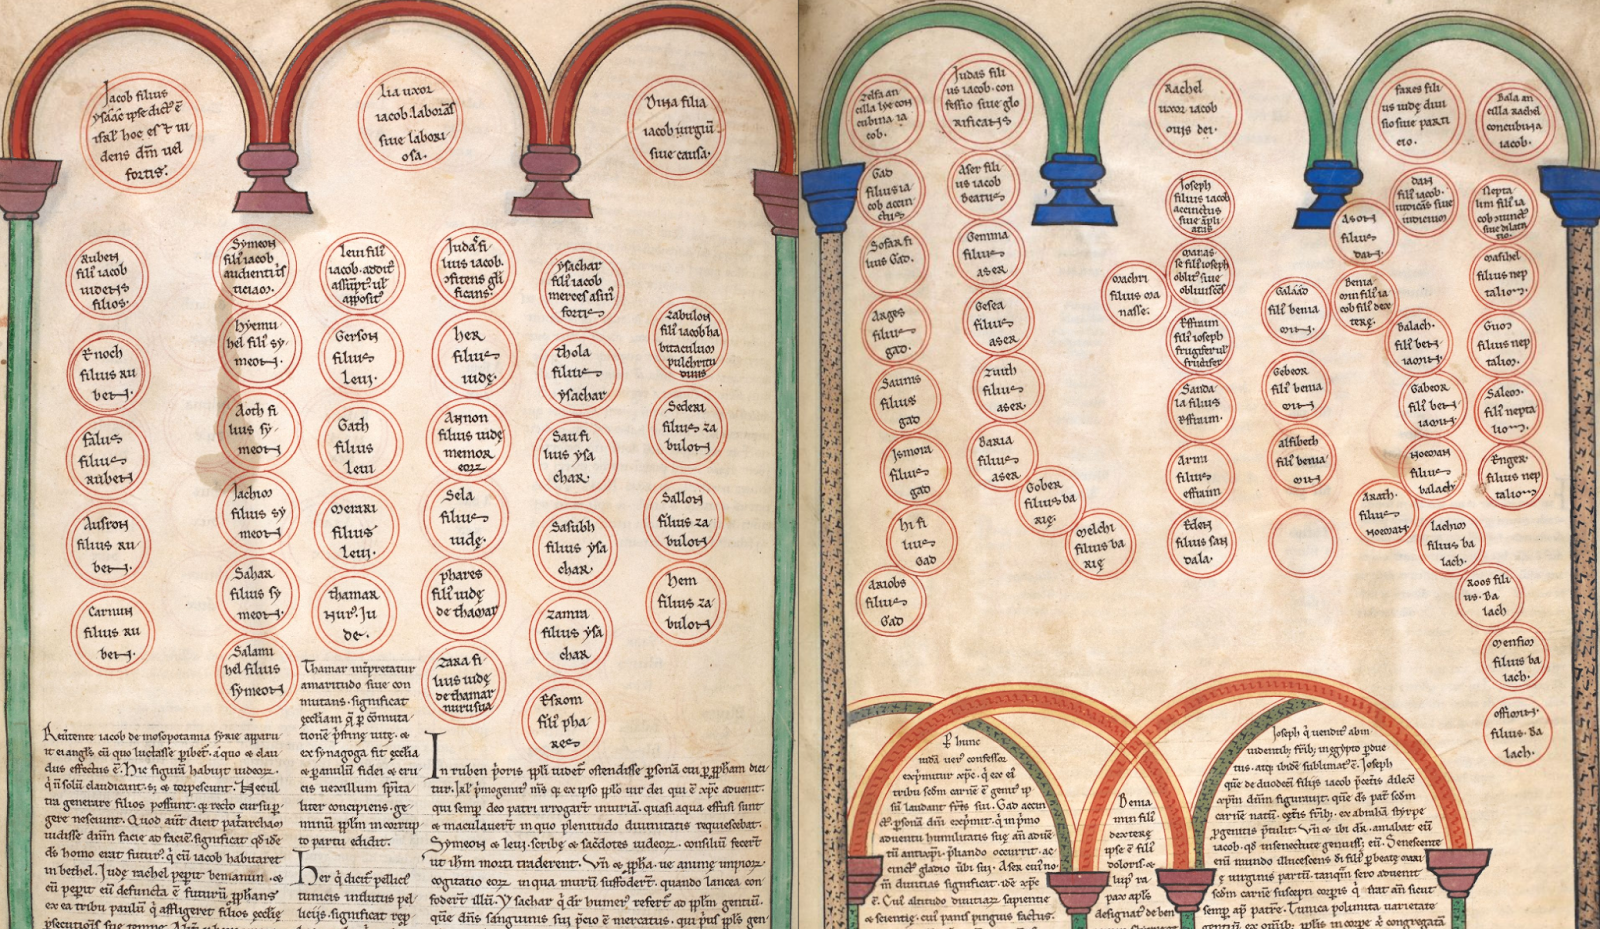
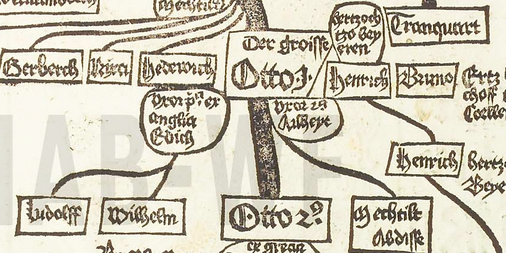
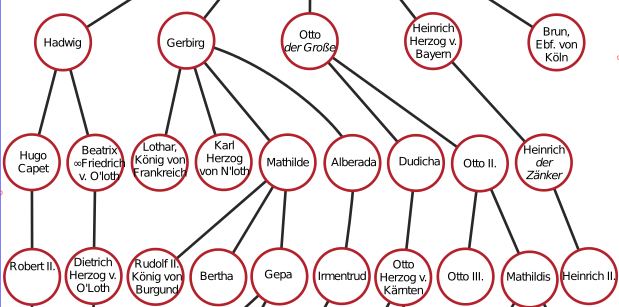
Europe's experiments with similar graphic layouts go back somewhat further. My own research has established the date of the oldest extant graphic genealogy as before 427 CE. Like the Tú, the Great Stemma also sets out a genealogy of Christ. You see a reconstruction of it on my website along with a link to the main publication about it.

The Orazio chart is likely to have been the first occasion when these separate traditions fused into a single creative work at the highest level of expertise.

Orazio may or may not have learned during his Franciscan formation in Teramo, Italy of the late antique Great Stemma. The Franciscans were a conservative order theologically, less intellectually adventurous than the Jesuits, but with a long-standing interest in graphics as a means to evangelize, so Orazio may well have remembered and kept an abiding impression in his mind of old posters and charts, even one based on work from 1,300 years earlier.

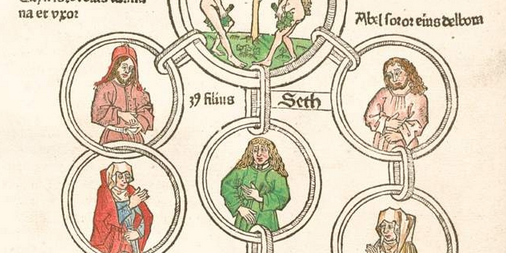
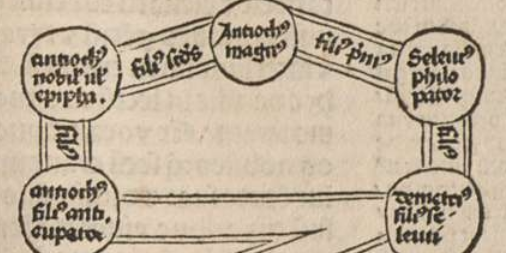
The central idea around which the Great Stemma is based is to show the Luke and Matthew genealogies as streams separating after David and then rejoining at Jesus, as follows:
The idea of presenting the two genealogies as streams or fila that part and then reunite at Christ is something so distinct, so inspired, and even so idiosyncratic that it is hard to avoid the impression that there is some kind of hidden chain of influence leading from the Great Stemma to the Tú.

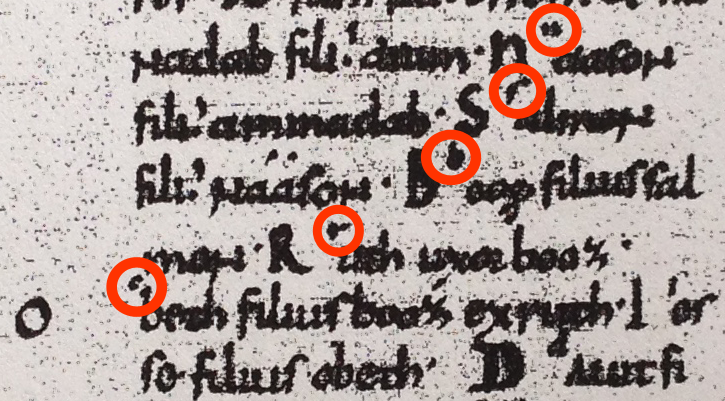
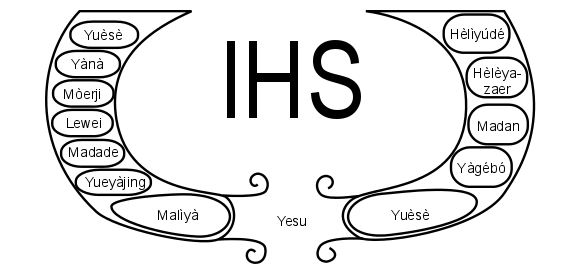
I have no knowledge of Chinese, so with the help of an excellent student of medicine and Chinese, Lennard Piggin, I transliterated the confluence section of the chart to pinyin so I could read it. I have not entered all the tone marks, as they are difficult to type, but you will get the idea:

This yielded something else that surprised me. The majority Catholic view of the two gospels holds that both Matthew and Luke set out an ancestry of Joseph (phoneticized Yuèsè in Chinese).

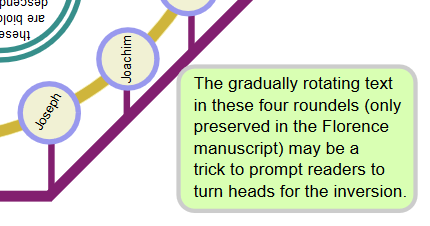
But here, both genealogies terminate at Yēsū (Jesus) and the name to the left of Jesus is Malíyá (Maria) and to the left of that is Yueyàjing (Joachim). Neither of the latter names is given in Luke 3:23.

The insertion of both names as a bridge can be traced back to an apocryphal second-century work, the Protevangelion of James. Along with the two gospels, the Protevangelion is the hidden, third documentary source on which the chart ultimately relies for its information. To find out more about the apocryphal figure of Joachim, read my Joachim article.

In this case too, the similarity of conception leading from the Great Stemma to the Tú is startling. The anonymous Great Stemma's main motivation appears to have been to propound the Joachimite theory. It was modified in later use to bring the chart into line with the orthodox Christian position.

But in the Tú, the Joachimite theory is revived. Dudink argues that there is an intermediate influence at work here:  the writings of the forger Gianni Nanni (1432-1502), better known as Annius of Viterbo. Orazio altered the Lucan names "Eli" and "Joseph", changing them to "Joachim" and "Maria" respectively, relying on a bogus claim by Annius to have "discovered" an ancient error in Luke.

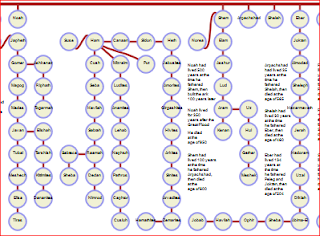
There is a third similarity between the Great Stemma and the Tú. In the text section of the Tú, Orazio set out an age-of-the-world chronology drawn from the Chronological Canons of Eusebius of Caesarea, and thus from the Septuagint and Vetus Latina version of the Old Testament, not from the Masoretic and Vulgate version which was authoritative for Catholics in 1704.

The Great Stemma is similarly based on a Vetus Latina chronology. There is however a key difference between it and the Tú: the Great Stemma omits a patriarch known as the Second Cainan or Kenan, whereas the Tú includes Cainan II (嘉宜南). You can find a full list of the names used in the Great Stemma on my Luke page. The names in the Tú have been published in full by Dudink.

The three resemblances are very striking, but I think on reflection that it is unlikely that Orazio ever actually saw the Great Stemma, let alone consciously reproduced it in a Chinese version.

What Orazio took to China is more likely to have been an undefined mental "picture" of the Jesus genealogy picked up during his formation with the help of some kind of visual teaching materials.

He must have explained to his partners in Shandong what he had seen in Italy and how he envisaged recreating this in China. During their collaboration, almost everything for the chart had to be created again from scratch. Not even a phoneticization of the biblical names into Mandarin forms existed yet. All the conversions had to be devised by Orazio and his Chinese scholarly partners. In many cases they are unique, and were not adopted by later translations of the Christian Bible to Chinese.

The chart, when finally published was therefore a vast and complex creative effort mingling advanced epistemological and communications ideas from east and west. I have very little knowledge of stemmatic graphics in China and will leave it to others to draw conclusions about that, but this story of fusion does reveal something interesting about the western side of the interaction.

There is only one copy of the Great Stemma in unadulterated form left in Italy, Florence plut. 20.54. Two others seem to have existed, but have vanished. I do not know of any post-Renaissance graphics directly based on the Great Stemma. It does however seem that despite the paucity of graphic evidence, elements of the tradition of the Great Stemma remained alive among the 17th-century Franciscan teachers who formed Orazio in the Papal States.

The idea of teaching the ancestry of Jesus by visualizing it rather than just talking about it does seem to have persisted, even though the tradition of copying the Great Stemma had by then ceased and most of the extant copies of this late antique masterwork had vanished. That China, not the West, put to paper the last trace of the tradition is one of the more remarkable paradoxes of history.

Cams, Mario. ‘Not Just a Jesuit Atlas of China: Qing Imperial Cartography and Its European Connections’. Imago Mundi 69, no. 2 (3 July 2017): 188–201. https://doi.org/10.1080/03085694.2017.1312114.
Chao, Sheau-yueh J. “Researching Your Asian Roots for Chinese-Americans.” Journal of East Asian Libraries 129, no. 1 (2003): 23–40.

Cohen, Myron L. “Lineage Organization in North China.” The Journal of Asian Studies 49, no. 03 (1990): 509–34.

Dudink, Ad. “Biblical Chronology and the Transmission of the Theory of Six ‘World Ages’ to China: Gezhi aolüe...(Outline of the Mystery [revealed Through] Natural Science; before 1723).” East Asian Science, Technology & Medicine 35 (2012): 89–138 (Online: paywall).

Johnston, Reginald F. Lion and Dragon in Northern China. New York: Dutton, 1910. Archive.org.

2014-12-06

Enemies of Hugh Capet

One of the difficulties of publishing a scholarly book is doubtless the fact that the time-span between research and hitting the market can be several years. This struck me when reading a couple of works from 20 years ago on the Stemma of Cunigunde. I mentioned this remarkable diagram some while back in a blog post.
A plot of it on my website allows you to see more detail. This diagram is the oldest visualization in existence of a genealogy that can be independently documented. The only older genealogical visualization is the Great Stemma, where many of the persons, ranging from David and Solomon to Jesus, are historical figures, but are documented by a single source only, the Jewish and Christian scriptures, and the diagram is not contemporaneous but based on that single source.

The great modern authority on medieval tree diagrams is Christiane Klapisch-Zuber, who published her study, L’Ombre des Ancêtres, in 2000. She rightly gave considerable attention to the Stemma of Cunigunde and its medieval evolution into various new formats.

What I now notice is that her investigation must have been conducted a good decade before her book's publication, because she does not cite the two key studies dating from 1992 and 1994, by Nora Gädeke and Karl Schmid, which advance our knowledge of the Stemma of Cunigunde.

Schmid's study of the Stemma was especially interesting. He instantly recognized that its subject and focus is Cunigunde (at the bottom left), not Charlemagne or any of the figures high up the diagram.

He proposed that the Munich manuscript is a copy, perhaps made decades later, of a document probably drawn up in Metz, where Cunigunde's villainous brother Dietrich II was bishop and no doubt had clerks and a library capable of drawing such a work. Schmid does not opt for a date, though tendentially he suggests this would have been after Cunigunde's coronation as empress in Rome in 1013.

The purpose of his article is to argue that the stemma's core content must go back to a 991 visualization that would have been drawn up by "Carolingian legitimists" in support of Karl, a child, as pretender to the kingship of West Francia in opposition to Hugh Capet (elected 987). Hugh won out and is now regarded as the first king of France, the legitimists lost, and little Karl (the last Carolus in the diagram) simply falls off the face of history. Whether he was killed or lived out a full life as a pitiable might-have-been is unknown. Instead he gains his place in history as the original inspiration for a very remarkable diagram.

The eye-catching festoons at the left and right of the drawing above would have been created to make room to add Cunigunde and the Ottonians to the anti-Capet diagram.

Schmid (Wikipedia entry) bases this ingenious lost-diagram hypothesis on an analysis of errors and non-sequiturs in the graphic arrangement that survives. His article is a most impressive feat of graphic reconstruction, and I think his point of view is convincing. As far as I know, this was the last scholarly thing he wrote. It was published following his 1993 death in a volume that contains his obituary.

From Forum Eeerste Wereldoorlog.nl
He even reaches back a little further, tentatively suggesting that the enemies of Hugh Capet may have found their model in a hypothetical document dating from the 978-984 war between Lothair of West Francia and the Ottonians. Schmid thinks that because the stemma often suppresses the title of "emperor" and because the final central roundel in the drawing above is empty, omitting the name of Louis le Fainéant which should obviously fill it, that ur-ur-diagram might have existed. He conjectures that this could have been a piece of proto-French political propaganda circulated during that conflict to ridicule the proto-Germans' pretensions to be upholding a (First) Reich. That is a sobering millennial thought in this year, when we often have in mind the sombre centenary of a war where elaborate French propaganda, like L'Impérial Semeur at right, so often mocked the Second Reich.

Gädeke, Nora. Zeugnisse bildlicher Darstellung der Nachkommenschaft Heinrichs I. Arbeiten zur Fruhmittelalterforschung 22. De Gruyter, 1992.
Klapisch-Zuber, Christiane. L’Ombre des Ancêtres. Paris: Fayard, 2000.
Schmid, Karl. “Ein verlorenes Stemma Regum Franciae. Zugleich ein Beitrag zur Entstehung und Funktion karolingischer (Bild-)Genealogien in salisch-staufischer Zeit.” Frühmittelalterliche Studien 28 (1994): 196–225. doi:10.1515/9783110242263.196.

2014-05-04

Translating Nonsense

How does one translate nonsense that has arisen when scribes fall into a doze and begin to write drivel? There is a celebrated passage in the Great Stemma which I have been looking at today which marks a low point in scriptorial quality control. It derives from the Septuagint version of the Book of Job. I have tried to collate it in six parallel lines of continuous text below:

LXX  οι δε ελθοντες προς αυτον φιλοι  
VL   Nam qui venerunt ad eum amici  eius hii fuerunt: 
del  Nam qui venerunt ad eum amichi eius hic fuerunt: Sophar Israel
gam  Nam qui venerunt ad eum amici  eius hii fuerunt: Sofar filius
alf  Nam qui venerunt ad eum amici  eius hii fuerunt: Sofar filius
bet  Nam qui venerunt ad eum amihi  eius hii fuerunt: Sofar filius

ελιφας των ησαυ υιων         θαιμανων βασιλευς 
Elifaz, de filiis Esau       Themanorum rex;
Elifaz, de filiis Esau       et Temanorum uxor filiis 
Elifaz, de filiis Esau       et Themanorum uxor et filiis
Elifas, de filiis Esau       et Temanorum uxor filiis 
Elifaz                       et Hemanorum uxor filiis

βαλδαδ ο σαυχαιων τυραννος
Baldad sauceorum tirannus;
Ammon                                 qui fuit Ar-auce tiranni
Ballenon filii Ballac  et filiis Amon qui fuit Cobar-auce tiramni 
Balenon filii Ballac uxor filiis Amon qui fuit Chobar-aucce tiranni 
Balexion             uxor filiis Amon qui fuit Bar-auce tiranni

σωφαρ ο μιναιων βασιλευς
Sophar mineorum rex
et Themas de filiis Elifaz dux Idumee
et Heman     filius Elifaz dux Idumee
et Temans    filius Elifaz dux Idumee
et Themas    filius Elifaz dux Idumee

The six texts are: the Septuagint, the Vetus Latina and the Great Stemma's delta, gamma, alpha and beta recensions. This text does not appear in modern bibles, as it has never been incorporated into the Masoretic or Vulgate versions, and must therefore be referenced as LXX Job 42:17e.

The context is that Job sits on his dung-heap, owning just a broken bit of pottery to wipe the discharge from his ulcers, lamenting and asking God what's up.

A trio of guys -- Eliphaz of Teman (a town in Edom); Bildad of Shuah; and Zophar of Naamath -- show up and make the snarky kind of unhelpful remarks that guys always make, to the effect that it might just be Job's own fault. We men tend to brutality.

Rabbis must have often been asked what rank these guys had. One suspects the three names are simply some kind of impenetrable humour, but a midrash which claims they are monarchs is recorded in the Septuagint.

Here is how the New English Translation of the Septuagint renders the midrash: Now the friends who came to him were: Eliphaz of the sons of Esau, king of the Thaimanites; Baldad, the tyrant of the Sauchites; Sophar, the king of the Minites.

The repetitious, inflated mess this turns into in the Great Stemma was first spotted by the great Yolanta Zaluska. I want to mention the passage in my planned book. It's a dilemma deciding which nonsense version to translate and how to render it. Here's one of the more absurd possibilities:
  • Sofar the son of Elifaz of the tribe of Esau
  • the wife of the Thaimanites
  • the sons of Balenon's son Ballac
  • Amon who was tyrant of Chobar-auce
  • Themas son of Elifaz, duke of Edom
That inflates the list to more than five visitors in the scribal version. Of course, the nonsense could be understood as meaning that a throng of sons came to visit Job too. In which case, the country lane outside Job's country estate in Uz would have had a parking problem with chariots, camels and donkey-carts jamming all available roadside space.

2013-11-05

Transcript in France

A transcription of the Great Stemma text from the Saint-Sever Beatus has appeared in France, along with a detailed introduction to the entire manuscript. There is no date on the transcription, but the file was last modified 2013 February 4, so I presume it was completed last winter. My own five-manuscript transcription does not include Saint-Sever, so scholars will now have six texts they can compare.

This appears to be only the second time, after my own publication of 2010, that the entire text of the diagram has been published. The authors of this welcome new work appear to be Jean Cabanot, who has a long association with studies of this codex, and Georges Pon. The complete history of the text's publication with editors in brackets would thus appear to be as follows:
  • 1951 transcription of the Genesis text from four bibles only (Bonifatius Fischer)
  • 2010 complete transcription on Piggin.net (Jean-Baptiste Piggin)
  • 2013 Saint-Sever transcription (Jean Cabanot and Georges Pon)
There is also an 80-page Introduction générale to the manuscript, apparently by the same authors. I have yet to read this, but from a digital search I note that it does not appear to mention the new edition of the Beatus Commentary by Roger Gryson. The website belongs to the Comité d’études pour l’Histoire et l’Art de la Gascogne.

Regrettably, there are no high-resolution scans of the manuscript itself. Some low-resolution scans are linked to from my website.

2013-10-21

Sicut Lucas

Something I have just noticed is that the art historian Marcia Growden translated into English in 1976 the fulcrum passage of both the Liber Genealogus and the Great Stemma:
Just as Luke the Evangelist has indicated that his line was traced through Nathan to Mary, so also the Evangelist Matthew showed that his line was traced through Solomon to Joseph. That is, out of the tribe of Judah. That the divine tribe appears to proceed to them and thus to Christ according to the flesh that it might be fulfilled which was written. Behold the lion from the tribe of Judah has conquered for the family tree of the Lord. He is the lion from Solomon and descendant of Nathan.
As far as I know this is the first stab at putting into English this mysterious key passage which explains the purpose of both works, yet leaves as many questions as it answers.

The translation, arguably the first ever into English, appears in the text of her Stanford doctoral thesis on the Gerona Beatus, The Narrative Sequence in the Preface to the Gerona Commentaries of Beatus on the Apocalypse. I am a bit baffled by her phrase "for the family tree of the Lord". My translation (in fact mainly the work of Seumas Macdonald) appears in my online collation of the text, and there is some discussion of it on my Liber Genealogus page:
Whereas the evangelist Luke traces the origin of Mary back to Nathan, the evangelist Mathew traces that of Joseph back to Solomon, demonstrating an ancestry from the tribe of Judah. Thus it is clear that these two are biologically descended from a single tribe, leading down to Christ, so that what was written might be fulfilled, "Behold, the lion of the tribe of Judah, the root of David, has prevailed" (Rev. 5:5), whereby the lion is Solomon, the root is Nathan.
I have not seen Growden's dissertation, but the passage is quoted by Jessica Sponsler in her own 2009 thesis at the University of North Carolina on the same topic, Defining the Boundaries of Self and Other in the Girona Beatus of 975. Growden appears to have gone on to become an art history professor at the University of Nevada in Reno.

2013-09-04

Cassiodorus Digital

Since I first published several years ago a hyperlinked listing of the 37 diagrams "made up" by Cassiodorus for his Institutiones, two key sources have become available digitally: the great 8th-century codex from Monte Cassino now at Bamberg, Msc. Patr. 61, which contains the complete set, probably in the final form approved by Cassiodorus for publication, and Mazarine 660, which contains some peculiar variations in the motifs used in the diagrams. The tabulated listing now includes links to all these images, making it an excellent tool for comparing their evolution in the first millennium. The drawings from Mazarine 660 are to be found on the Liber Floridus illuminations site.

It is remarkable how much has changed in the 13 years since the definitive article on the Cassiodorus diagrams by Michael Gorman was published and included this comment:
Today it is relatively cheap and easy to buy a microfilm of a manuscript and print it out on paper, but in the 1930s this was a luxury that could probably not even be imagined ... I hope this note is sufficient to stimulate interest in preparing a facsimile of the Bamberg manuscript ... (pages 39, 41)
Since that was written, another unimaginable barrier has been breached and it has become possible for anyone to see these manuscripts at no charge via the internet, making facsimiles less necessary.

This update is one of three data upgrades to the Macro-Typography website that have been accomplished in the past month. The collation of the Great Stemma now contains a properly checked fifth and last set of text variations, from the Gamma manuscripts. This was previously bodged together from Fischer's Genesis edition and my transcription of the Urgell Beatus. The Gamma text is now based on a sounder manuscript, that in the San Juan Bible, with the Urgell Beatus only required to fill gaps. This data entry was a lot of work at an unwelcome time, but means that I can now close off the transcription phase with a good conscience.

The third of the upgrades has been some supplementing of the Petrus Pictaviensis table on my website. The major new find there has been a digitization (by Heidelberg) of one of the manuscripts in the Vatican Library. I have also restored the Walters digitization which for some inexplicable reason I had deleted from the list. This means there is an even wider range of quality digitizations -- 22 -- of the Compendium available for comparison.

In addition to these, I continue to keep an eye out for any more additions to the Stemma of Boethius tabulation I completed in the late spring.

Gorman, Michael. “The Diagrams in the Oldest Manuscript of Cassiodor’s Institutiones.” Revue Bénédictine no. 110 (2000): 27–41.

2013-06-23

Pliny Manuscript

Roger Pearse's post also points us to the principal manuscript of Book 35 of Pliny's Natural History where the practice of placing a "stemma" in the entrance area of a patrician Roman home is mentioned at 35.2. The best manuscript of Book 35 is preserved in a very cleanly penned and well preserved codex in Bamberg, Germany.

A digitization can be consulted online. The text on stemmata can be consulted at Perseus, where there is also an English translation. The matching page of the Bamberg codex is 78v, first column.

2013-05-26

Stemma of Boethius

A new tabulation of online Boethius manuscripts which contain his famous stemma, or arbor porphyriana, has just appeared on my website. (Here.) I have not done serious work on Boethius for more than three years, so I spent a couple of days looking again at the sources.

I find it remarkable that so many of these documents can now be seen remotely via the internet: there are no fewer than eight manuscripts accessible, and three of them duplicate the stemma, so we have a total of eleven early medieval drawings to study.

A task remains for any eager reader. I have not heard that the Greek text of Porphyry, or the translations to Latin, Syriac and Arabic (list by Roger Pearse), contain such a diagram. One is reluctant to trust the critical editions, since text scholars generally leave out diagrams. If anyone would care to comb online versions of these, it would be good to have a clear yes-or-no answer about this.