Showing posts with label Maps. Show all posts

2015-02-28

Portolan Charts of Pietro Vesconte

Among the finest things to be made available online this week from the Biblioteca Apostolica Vaticana (BAV) digitization programme in Rome is a codex, Vat. lat. 2972, which contains portolan charts which though unsigned can be reliably attributed to the remarkable mapmaker Pietro Vesconte and dated to about 1320.

Portolan charts are, for all intents and purposes, the first true western maps. Everything that precedes them, ought, in my view, to be classed as geographical diagrams.

A portolan chart was something novel and unprecedented, showing the world deskewed and to scale. Geographical diagrams like the BL's Psalter Map of 1265 (see this flash version) showed the human world as mentally represented. By contrast, portolan charts, with compass lines superimposed, show the physical world as one navigates it, with the entire coastline of a sea fully labelled without regard for the social standing of the places on the coast. When a vessel is trapped by a landward wind, any of the places here offers a potential haven on a lee shore. The Vat. lat. 2972 codex contains an atlas of five sheets and is part of Marino Sanudo's Liber secretorum, a book devoted to a mad plot to destroy the Muslim world. Here is the atlas version of the English Channel (folio 110v):
In the middle you see Dumqerqo (Dunkirk), Gravallinga (Gravelines), Calles (Calais) and Bellogna (Boulogne), and at right Parissius (Paris) and Cam (Caen).

Tony Campbell, former map librarian of the British Library, wrote a fine descriptive summary about portolan charts earlier in February on the Pelagios blog while presenting the portolan component of the Pelagios project. He tells us at least one portolan chart from the very end of the 13th century survives. The BAV's, from just two decades later in 1320, will likely become a prime reference on the internet. Yale has a later chart from 1403 online.

Curiously, Genoa-born Vesconte also did mappaemundi similar to that in the Psalter Map. He was on the cusp of the transition from old to new. Here are the British Isles in his Vat. lat. 2972 mappamundi. Since this map (112v) has east at its top, Ireland (Ybernia) is at the bottom of this grouping:

Update

I have tried to tag all the places on the continental coast in the portolan chart above, but some defeat me. Here is what I have resolved, after consulting Campbell's general toponymic listing:
#Bruges
? (Cavo Sta Catalina identified as Pointe de Zand by Campbell. Not clear what St Catherine's; the source document would have been Portuguese.)
#Oostende
#Nieuwpoort
#Dunkerque
#Gravelines
#Calais
#Wissant
#Boulogne
#Étaples
? (vapa identified by Campbell as Port St. Quentin or Eu.)
#Dieppe
#Fécamp
? (no port marked; Campbell proposes Chef de Caux)
? (no port marked, so "loira" may be an inland place)
#Quillebeuf
#Harfleur (on wrong side of Seine!)
#Honfleur
#Touques
#Caen
#Ouistreham

Some of these ports no longer exist, the rivers having later silted up and become unnavigable, leaving coastal areas that today are mainly a zone of holiday beaches.

Tony Campbell published a major new article on March 2, 2015 on the Carte Pisane, which is traditionally regarded as the oldest portolan chart, but is now the focus of controversy. He sets out arguments as to why it should be dated to the very end of the 13th century.

2014-03-20

British Library Mappaemundi

More digital mappaemundi are due soon, from the British Library website. I haven't posted about digital maps since 2010 but have been doing some work on map vectorizing in the background.

Here is a plot of the Dura-Europos map - a completely vectorized trace - which is an example of what could be done to make a whole range of first-millennium maps readable to modern human eyes (and machine-readable too):
The idea is to trace the actual lines on the map and digitize these with drawing software, as I have done for various diagrams, such as Lambert's stemma on Piggin.net.

As far as I can see, Virtual Mappaemundi (VM) will only digitize the script of the maps, but will not vectorize the lines. Maybe this is an opportunity to extend the process by crowd-sourcing?

The March 14 post on the BL blog by Cat Crossley about the digitizations of the nine mappaemundi doesn't tell us a whole lot about the technology, but Cat has just tweeted back:
I could only track down low-res pics before getting the blog out, rest assured all VM project images are hi-res + magnificent!

2013-09-17

Berlin Cab Fare Calculator

A while back I quoted Mark Twain on the subject of Berlin's cab-fare calculator at the end of the 19th century. This was a map where "every street is sectioned off like a string of long beads of different colors". I mistakenly described it as a tramlines map, since Berlin had horse-drawn trams at that time. However it is quite clear from Twain's text that this map was used to regulate hansom-cab traffic.

I have now located an online reproduction of the map dated September 1884. It is described as a Droschken-Wegemesser, a distance calculator for cabs, and it is plain that this is what Mark Twain was describing in his April 3, 1892 article.

The text indicates that each coloured segment was about 160 metres long and about 15 segments, or 2.4 kilometres, could be covered by a cab in a quarter of an hour.


The cabs must have been pretty speedy. Presumably major intersections had traffic policemen, but much of the traffic would have proceeded by the rule of shout and shove.

To ride a bicycle, morning and evening, between the main train station (then the Lehrter Bahnhof) and what used to be the site of the Jerusalem Church takes me 15 or 16 minutes in each direction. My route comprises 21 coloured segments of the map. So on the pedals, I am only about 40 per cent faster than a 19th century A-grade horse.

The reproduction is on a page presenting twelve historic Berlin maps. They have been re-published by the Berlin Public Library and I recommend you visit to see a greatly magnified version (under the heading Mai). Clearly this map is diagrammatic in use, but not diagrammatic in its overall form. The underlying form is a conventional street map.

2013-07-28

Railway Diagrams

Credit to Daniel Stuckey for pointing out an interesting new diagram proposal for the New York subway from Max Roberts, as reported on Fast Coexist. This employs concentric lines, a very nice design idea, and it is a lot more evenly laid out than the Massimo Vignelli design which I discussed on this blog one year ago.


Roberts' website contains a wealth of interesting history and comment on the London Tube diagram. In particular, he points out a variety of continental precursors, and he discounts the supposed connection between the network diagram and electrical circuit diagrams. Go explore!

One of his most interesting pages is devoted to denying what he calls London Underground myths about the Harry Beck diagram. There he points to the following Berlin S-Bahn diagram of 1931:


One of my long-put-off projects has been to dig up the tramlines map used in Berlin in the 1890s and described by Mark Twain in The Chicago of Europe as follows:
Any stranger can check the distance off--by means of the most curious map I am acquainted with. It is issued by the city government and can be bought in any shop for a trifle. In it every street is sectioned off like a string of long beads of different colors. Each long bead represents a minute's travel, and when you have covered fifteen of the beads you have got your money's worth. This map of Berlin is a gay-colored maze, and looks like pictures of the circulation of the blood. 
I have not been able to discover any images or paper copies of the map Twain saw, but it certainly does sound as if it too was based on a system of nodes and lines.

2013-02-03

Board Game

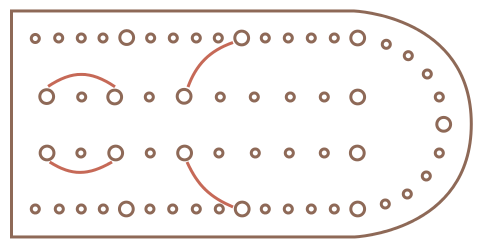
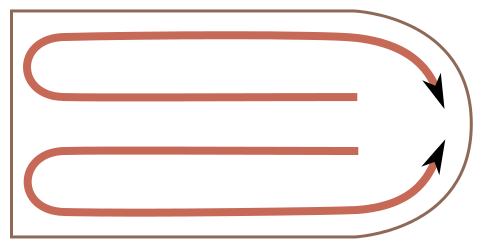
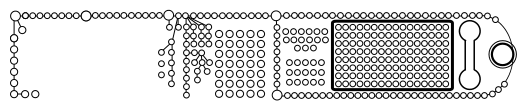
After searching for some time for any ancient board game on which the Great Stemma might possibly be modelled, I believe the best match would be an Egyptian-devised game-board with 58 holes which has some similarities with our snakes and ladders. Here is a schematic of the game-board, based on a 1952 drawing by Harold Murray in his History of Board Games Other than Chess.


While this is neutrally known among scholars as the Game of Fifty-Eight Holes, in a 2000 article (all references below), Anne-Elizabeth Dunn-Vaturi notes that archaeologists have often called the game Hounds and Jackals. She  proposes her own name for the game, the Monkey Race. According to William Hallo, this game, apparently played with dice, has more than 4,000 years of history.
Such boards are first attested in IXth Dynasty Egypt (ca. 2100 B.C.) and there and in Palestine are made of wood or ivory, elsewhere of stone or clay. Examples of the latter are known from Ras el Ayin and Tell Ajlun in Syria, from Mesopotamia, and from Susa in Elam. Some examples even come from the palace of Esarhaddon and bear his royal inscription. They date from all periods; indeed, their modern counterparts are in use in the Near East to this day. (Hallo, 1996, p. 114)
Hallo does not say who plays the game in modern times, and I can find no one else who claims this to be so. Indeed, the precise rules of the advanced games (one assumes there were many variations) seem to be now lost, and the presentation of the archaeological record suggests the game may have vanished by Roman times.

It is notable that all the boards recovered are much smaller than we would employ for a table-top board game nowadays. In size they are closer to a smartphone or a small tablet computer. For images, one should consult the Louvre website where exquisite variations are assembled into a very impressive interactive page, the best I have found on the internet.
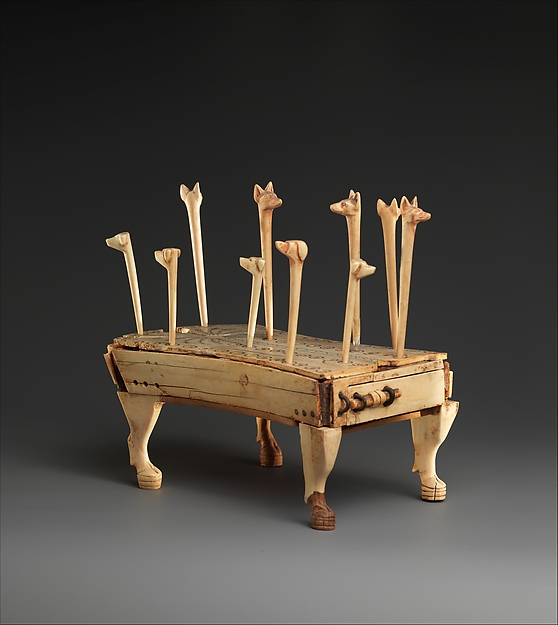
There is a deluxe version of the game (linked picture above) in the Metropolitan Museum of Art in New York.  Despite appearances, it is not a billiard table, but a tiny toy just 15 centimetres long. The stakes in the picture are the counters, five per player, used during play. The Met has six high-resolution photos where you can zoom in for a closer look.This Egyptian grave offering from Thebes explains the order of play through the 29 holes by each player as follows:


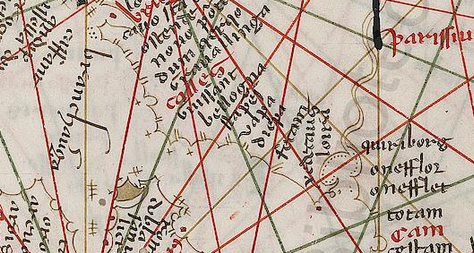
The final curves, converging after running along the perimeter, do bear a remarkable resemblance to the closing stages of the fila as they converge on the right side of the Great Stemma, or of the Amiata Stemma (below). I rotated Murray's drawing (above) 180 degrees so you could see this resemblance more plainly.


I have always considered the diagram's circle-by-circle progress to be inspired by a board game rather than by a topological map. Human problem solving and inventiveness is often a matter of transferring some old and familiar method into a new context, then elaborating this new technique by a cumulative process.

I do not suggest that the Great Stemma copies or evokes the 58-hole board game, but simply that the game, which is said to have been played in an altered version among the Copts of Egypt in Late Antiquity (see an image of the Louvre's Coptic variation), might have been the germ that set off a bright idea in the 5th century.

Richard S. Ellis and Briggs Buchanan provide a detailed scholarly discussion of such 58-hole boards. They group them by outline (the commonest are shaped like an axe-head or fish) and offer many line drawings in their 1966 article dedicated to a single artefact, An Old Babylonian Gameboard with Sculptured Decoration, in the Journal of Near Eastern Studies (JSTOR). For older materials, see French archaeologist Roland de Mecquenem's 1905 report, Offrandes de fondation du Temple de Chouchinak, where there are line drawings of several tiny boards from Iran, generally carved from limestone and less than 10 centimetres long. That report is online at Archive.org. See also Iranica Online. Various enthusiast links on the topic have been collected by Alain Tilmant.

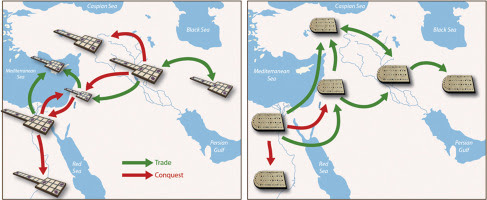
Dunn-Vaturi, whose 2000 bibliography should be consulted, is one of the authors of a current article, Cultural transmission in the ancient Near East: twenty squares and fifty-eight holes (citation below).  It includes the above maps, which I am also linking to with Blogger (without copying) so that you can see them. The left map suggests how the game is likely to have spread out from Egypt: the other map deals with the "royal game of Ur", a similarly popular 20-square board game.

Also available: a February 2012 lecture by Dunn-Vaturi on video (in English), where she suggests (at 1:20) that a Babylonian form of the game board may also have symbolized the human body, and quotes the theories of Carl Schuster that the joints on such a "rebirth" symbol may have been used as a palaeolithic mnemonic system to construct genealogies. The game of 58 holes is among those currently on display at the Musée de Cluny in Paris until March 4. See also Dunn-Vaturi's notice about the game at the Louvre and a November 2012 radio interview (in French).

Dunn-Vaturi, Anne-Elizabeth. ‘“The Monkey Race” – Remarks on Board Games Accessories’. Board Game Studies, no. 3 (2000). http://www.boardgamestudies.info/pdf/issue3/BGS3Vaturi.pdf.

Ellis, Richard S., and Briggs Buchanan. ‘An old Babylonian gameboard with sculptured decoration’. Journal of Near Eastern Studies 25, no. 3 (July 1966): 192–201. http://www.jstor.org/stable/10.2307/543265.

Hallo, William W. ‘Games’. In Origins: The Ancient Near Eastern Background of Some Modern Western Institutions. Brill, 1996.

Mecquenem, Roland de. ‘Offrandes de fondation du Temple de Chouchinak’. Mémoires de la Mission Archéologique de Perse 7 (1905): 61–130. http://archive.org/stream/mmoires07franuoft#page/104/mode/2up.

De Voogt, Alex, Anne-Elizabeth Dunn-Vaturi, and Jelmer W. Eerkens. ‘Cultural transmission in the ancient Near East: twenty squares and fifty-eight holes’. Journal of Archaeological Science 40, no. 4 (April 2013): 1715–1730. http://www.sciencedirect.com/science/article/pii/S0305440312004955.

2012-08-12

Subway Map

A nice piece appeared Monday in the International Herald Tribune on the 1972-79 New York City Subway Diagram. Alice Rawsthorn tells us that that the diagram was re-activated this year on the Weekender, a page that alerts travellers to weekend construction and maintenance work on the train system:

Some diagrams fail because they do not offer any advantages over existing methods: a very small "family tree" which only covers two generations – a person and their parents – provides no benefit compared to describing the family verbally. Others fail because they over-reach themselves. 

New York City's Metropolitan Transportation Authority introduced a system diagram designed by Massimo Vignelli in 1972. It was based on Harry Beck's 1931 design for the London Underground. But New York City's rail engineers had built a system that could not be well diagrammed. The tangle of rail lines built through Lower Manhattan remained a tangle despite being schematized; the artwork was cluttered; worst of all, the design failed to connect to pre-existing mental representations of the city's bizarre geography. The MTA retired the Vignelli diagram in 1979 in the face of public criticism. 

New York City's current subway diagram, which is like a skin superimposed on a simplified map of the city, is an easier connect between its designer and its readers. Even tourists find it easier to find their way with the current map.

2011-08-22

Stemma, Maps and Matrices

Now that we have the Great Stemma published online, it's a good time to consider what sort of commonalities it has with the "arbor juris" diagrams in Isidore's Etymologies and with the Peutinger Map. The most important observation is that all three are in a sense calques of the board game, where the meaning arises from traversing through the diagram, much as you jump a counter over the squares or circles of a board towards a goal.

As an itinerarium, Peutinger is all about paths and distances, and not at all about spatial arrangements. One might argue that this is an adaptation to fit its roll form, but I wonder if this isn't a kind of deliberate elaboration from what would be needed for a mere map into something more sophisticated. As it happens, today's IHT edition of the New York Times reports on an ingenious new way of representing cities that overlaps a perspective view into a bird's eye view. It was designed by London's Berg studio and is an exhibit at the NY Museum of Modern Art. The Peutinger Map may not be a broken or primitive map, but instead a highly sophisticated meta-map like the Berg one (I won't comment here on the Richard Talbert proposal that the map is more show-off than practical).

One could argue that the common feature of Peutinger, the arbor iuris, the Great Stemma and also items such as the arbor porphyriana is the invitation to the reader to discover and explore paths, usually crooked paths. That is what the fila and the hypothetical timeline of the Great Stemma are about. The open question is about how accurately the fila and timeline were aligned with one another.

One important ancillary point, to my mind, is that our knowledge of all these graphic schemes is diminished by the difficulty that every scribe, whether Antique or medieval, must have had in accurately copying technical drawings by hand. Last year, I copied the triangular version of the "arbor iuris" and found it a very tricky task, even with good graphics software to help me.

Practice at copying these ingenious graphics has been helpful in understanding their transmission. When I am looking at a poor copy of a drawing, I now assume that its predecessor was more observant of the regularities generally. The more accurate predecessors of these drawings might have had a lot more fine-scale axial information, which is the easiest feature to get out of alignment, as we also seen in the Eusebian Chronological Canons.

But we cannot even begin to reverse this degradation unless we know what equipment such a copyist used when reproducing such drawings, and there I am afraid I have not read enough research. My understanding is that desks were uncommon: according to Kurt Weitzmann, texts were commonly copied onto papyrus rolls by a scribe sitting tailor-style, wearing a tight skirt as the support for his papyrus, which was laid obliquely over the left knee. In the early codex period, the folios were also inscribed on two knees (at least that is true of the Spanish monastery depicted in one of the Beatus codices). It seems to me that big graphics like the Great Stemma could not be competently copied that way, especially if straight axes had to be preserved. I have not studied how paintings were reproduced, but would guess that this done on tables or easels, since the artist had to be at some distance from his canvas to wield his brush.

When we consider how a pen-drawing was copied, I can only speculate. My guess would be that this was a job for a specialist. A tracing through translucent "paper" of some nature? Hardly likely, as the customer would surely expect a product on a robust support. In the 19th century, technical draftsmen used technology such as pantagraphs, but I doubt if these were known in Late Antiquity.

Again, I am only guessing, but I would suppose that the most efficient method would be to stretch a net over the source, another net over the destination, and plot each square or hexagon from one to the other. If a non-specialist scribe were given the task, he might not have the equipment, or the training, or the wit, or the time to do this. If he were particularly incompetent, he would not even complete each panel left to right but might simply hurl squiggles on the page to represent his "overall impression" of the model, then fill the gaps. The Urgell Beatus version of the Great Stemma exemplifies that sort of chaotic, ill-planned copy. It is hardly surprising that we have rather little of the pen-drawings of Antiquity.

Now, I think this encourages us to contemplate the question of Antique "technical" drawing with more attention to the intelligence behind each drawing than to the deficiencies in execution of any of its copies (this was my criticism of Klapisch-Zuber). To some extent, we may be able to at least discover the right questions to ask by looking at collective memory, the practices in other periods, and even our own perceptions. The answers to those questions naturally depend on evidence, but we should try to connect to the intelligence or the intention of the Antique authors.

2011-03-09

Greek Place-Names

An interesting blog post from last year by Nick Nicholas on old Greek names for a stretch of coast that is much in the news at the moment. Hippolytus's Chronicon comprehensively lists places that a mariner might need to know about on the desert coast of North Africa.

2010-09-20

Mappaemundi

The Digital Mappaemundi Project contains a very useful English translation of the geographical text from the Historiarum Adversum Paganos Libri VII (Seven Books of History against the Pagans) of Paulus Orosius. He was an Iberian priest (ca. 385-420) who was commissioned by St. Augustine of Hippo to write up the story of the bad old world. Digital Mappaemundi looks as if it will become a wonderful and important resource: the maps are high-quality digital images from medieval manuscripts and the plan is to completely index and cross-reference them.